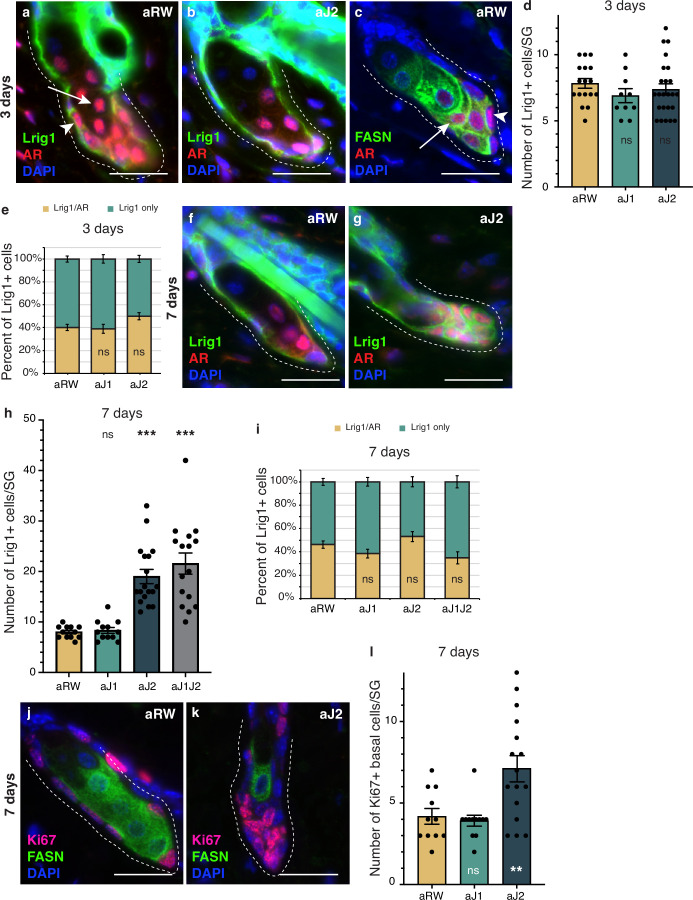
Figure 4. Notch activity in the sebaceous gland (SG) stem cells is required to prevent unregulated progenitor proliferation.
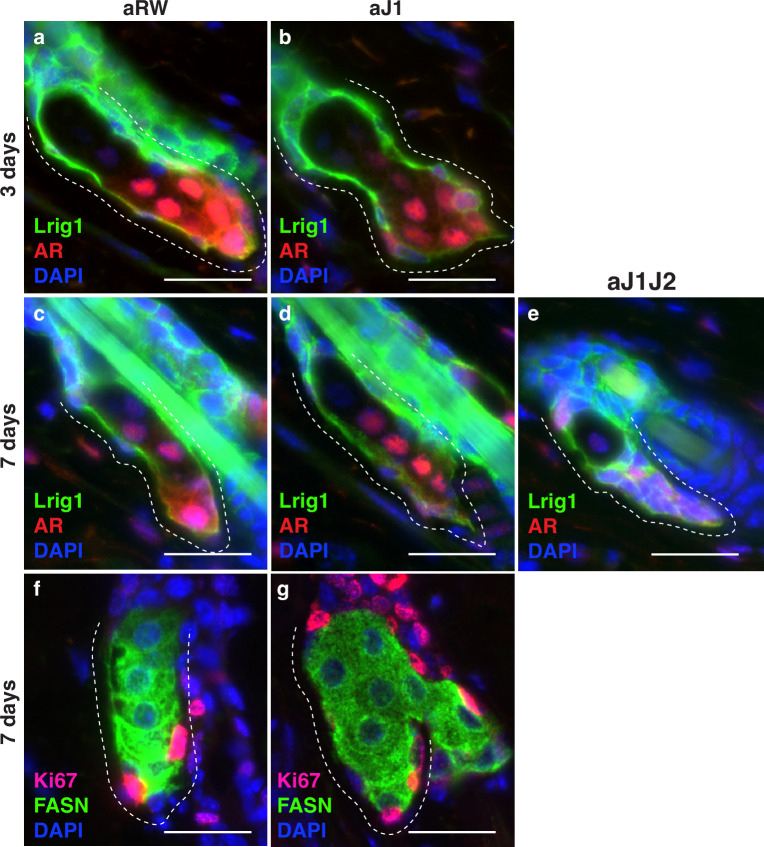
(a,b) Representative co-stain images for Lrig1 and androgen receptor (AR) in SGs from mice (n=5 each) treated with aRW (a) and aJ2 (b), 3 d post-treatment. (c) A representative co-stain image for fatty acid synthase (FASN) and AR in an SG from mice (n=5 each) treated with aRW, 3 d post-treatment. Arrows point to sebocytes, and arrowheads point to progenitor cells. (d) Quantification of the number of cells expressing Lrig1 in each SG, 3 d post-treatment with aRW, aJ1. and aJ2. p-values: aJ1=0.152, aJ2=0.450. (e) Quantification of what percentage of the Lrig1 + cells express AR, 3 d post-treatment with aRW, aJ1, and aJ2. p-values: aJ1=0.789, aJ2=0.028. (d and e) Total n of SGs quantified per treatment: aRW = 17, aJ1=10, aJ2=24. (f,g) Representative co-stain images for Lrig1 and AR in SGs from mice (n=5 each) treated with aRW (f) and aJ2 (g), 7 d post-treatment. (h) Quantification of the number of cells expressing Lrig1 in each SG, 7 d after treatment with aRW, aJ1, aJ2, and aJ1J2. p-values: aJ1=0.628, aJ2=9.06E-07, aJ1J2=7.88E-06. (i) Quantification of what percentage of the Lrig1 + cells express AR, 7 d after treatment with aRW, aJ1, aJ2, and aJ1J2. p-values: aJ1=0.117, aJ2=0.248, aJ1J2=0.091. (h and i) Total n of SGs quantified per treatment: aRW = 12, aJ1=12, aJ2=18, aJ1J2=16. (j,k) Representative co-stain images for Ki67 and FASN in SGs from mice (n=5 each) treated with aRW (j) and aJ2 (k), 7 d post-treatment. (l) Quantification of the number of cells expressing Ki67 in each SG, 7 d after treatment with aRW, aJ1, and aJ2. p-values: aJ1=0.652, aJ2=0.009. Total n of SGs quantified per treatment: aRW = 11, aJ1=12, aJ2=16. Student’s t-test used for statistical analysis. All treatments were compared against aRW. Error bars represent SEM. Scale bars are 25 μm.


