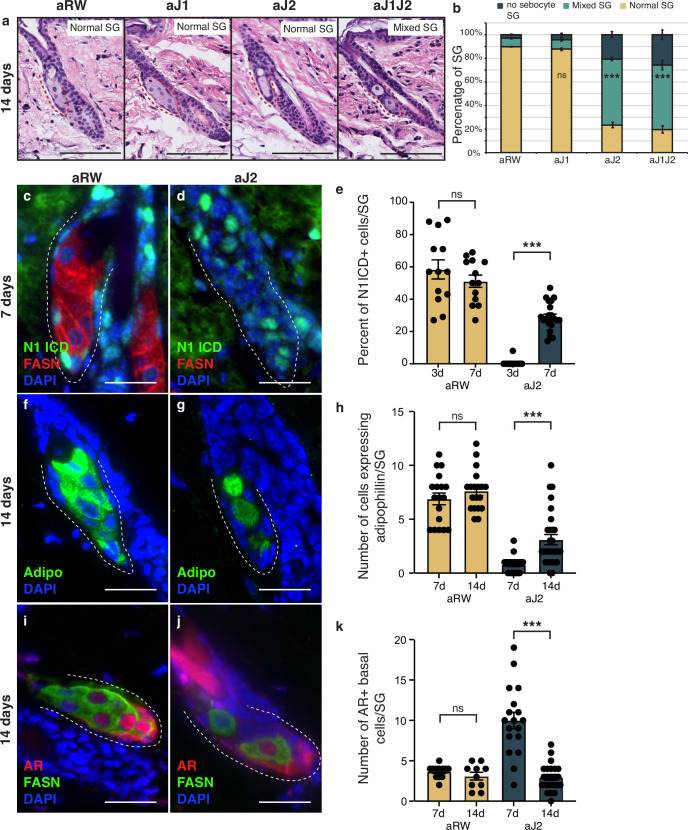
Figure 5. The block in sebocyte differentiation is lifted upon recovery of Notch activity.
(a) Representative hematoxylin and eosin (H&E) images of sebaceous glands (SGs) from mice (n=5 each) treated with aRW, aJ1, aJ2, and aJ1J2, 14 d post treatment. (b) Quantification of type of SG found after each treatment. The SGs were divided into three categories: normal SGs containing a characteristic number of sebocytes (normal SG), SGs containing a mix of sebocytes and basal-like cells (mixed SG), and SGs containing no sebocytes and only basal-like cells (no sebocyte SG). p-values: aJ1=0.535, aJ2=2.90E-87, aJ1J2=1.73E-92. Chi-square test used for statistical analysis. All treatments were compared against aRW. Total n of SGs quantified per treatment: aRW = 485, aJ1=430, aJ2=394, aJ1J2=364. Scale bars are 100 μm. (c,d) Representative co-stain images for N1ICD and fatty acid synthase (FASN) in SGs from mice (n=5 each) treated with aRW (c) and aJ2 (d), 7 d post-treatment. (e) Quantification of the percentage of N1ICD + cells in SGs from mice (n=5 each) treated with aRW and aJ2, 3 and 7 d post-treatment. Percentage was calculated by dividing the number of N1ICD+ cells by the total number of basal-like cells in each SG. p-values: for comparison between day 3 and day 7 for aRW treatment = 0.297, for comparison between day 3 and day 7 for aJ2 treatment = 1.00E-14. Total n of SGs quantified per treatment: aRW at 3 d = 13, aRW at 7 d = 13, aJ2 at 3 d = 15, aJ2 at 7 d=22. (f,g) Representative adipophilin staining in SGs from mice (n=5 each) treated with aRW (f) and aJ2 (g), 14 d post treatment. (h) Quantification of the number of cells expressing adipophiln in each SG, 7 and 14 d after treatment with aRW, and aJ2. p-values: for comparison between day 7 and day 14 for aRW treatment = 0.292, for comparison between day 7 and day 14 for aJ2 treatment = 1.38E-4. Total n of SGs quantified per treatment: aRW at 7 d = 18, aRW at 14 d = 19, aJ2 at 7 d = 22, aJ2 at 14 d=29. (i,j) Representative co-stain images for androgen receptor (AR) and FASN in SGs from mice (n=5 each) treated with aRW (i) and aJ2 (j), 14 d post-treatment. (k) Quantification of the number of cells expressing AR in each SG, 7 and 14 d after treatment with aRW and aJ2. p-values: for comparison between day 7 and day 14 for aRW treatment = 0.273, for comparison between day 7 and day 14 for aJ2 treatment=9.53E-09. Total n of SGs quantified per treatment: aRW at 7 d=12, aRW at 14 d=10, aJ2 at 7 d=18, aJ2 at 14 d=23. Student’s t-test used for statistical analysis. Error bars represent SEM. Scale bars are 25 μm.


