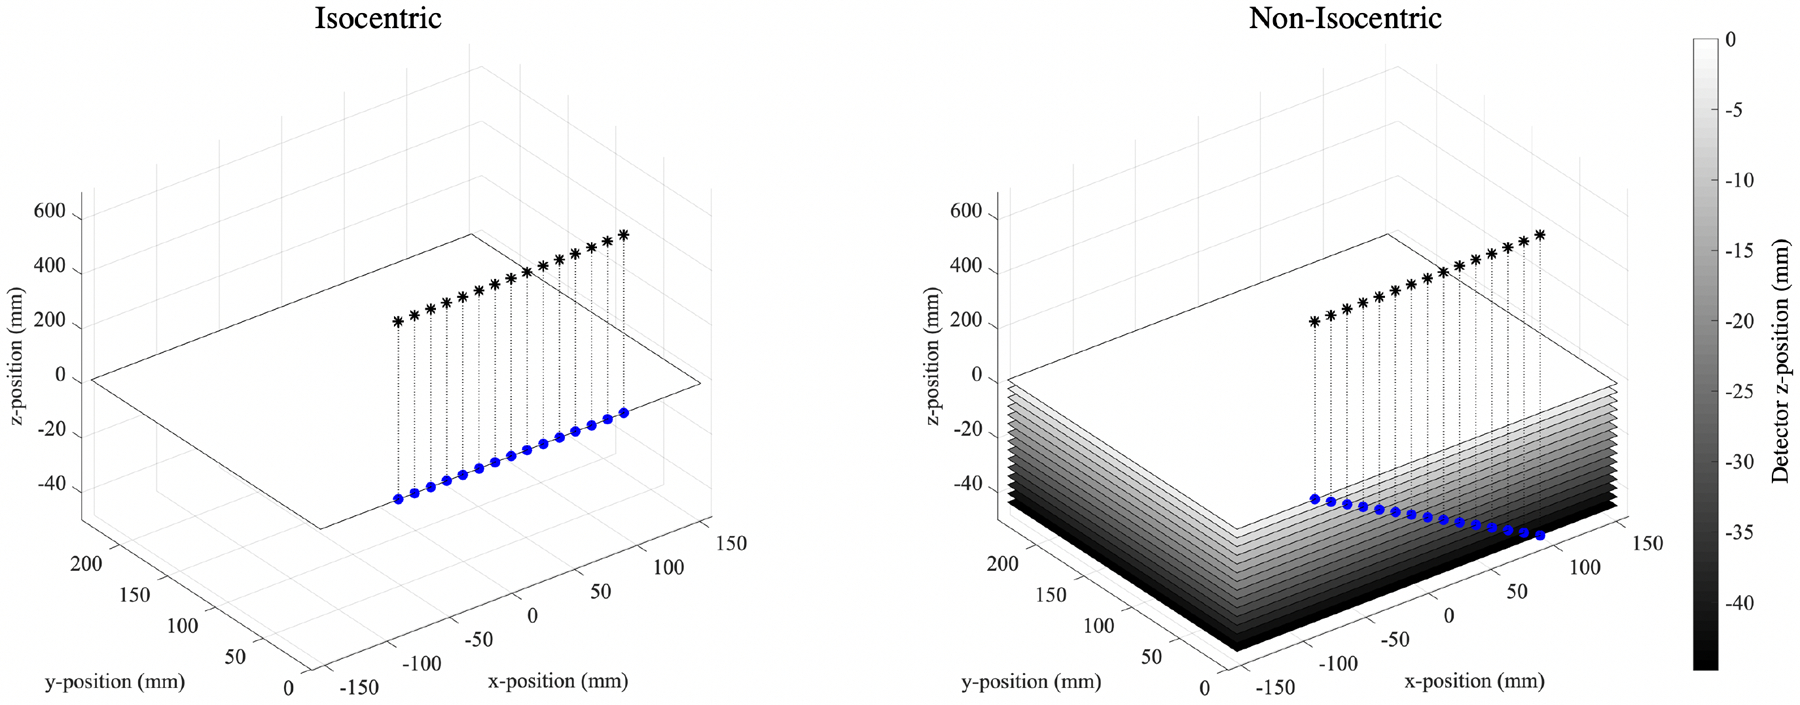
Figure 1:

The two acquisition geometries that are used to simulate the NGT prototype. The black stars and blue dots indicate the position of the focal spot in the focal spot plane and the corresponding position of the focal spot relative to the detector position, respectively. NB: the positive and negative z-axes are scaled differently.
