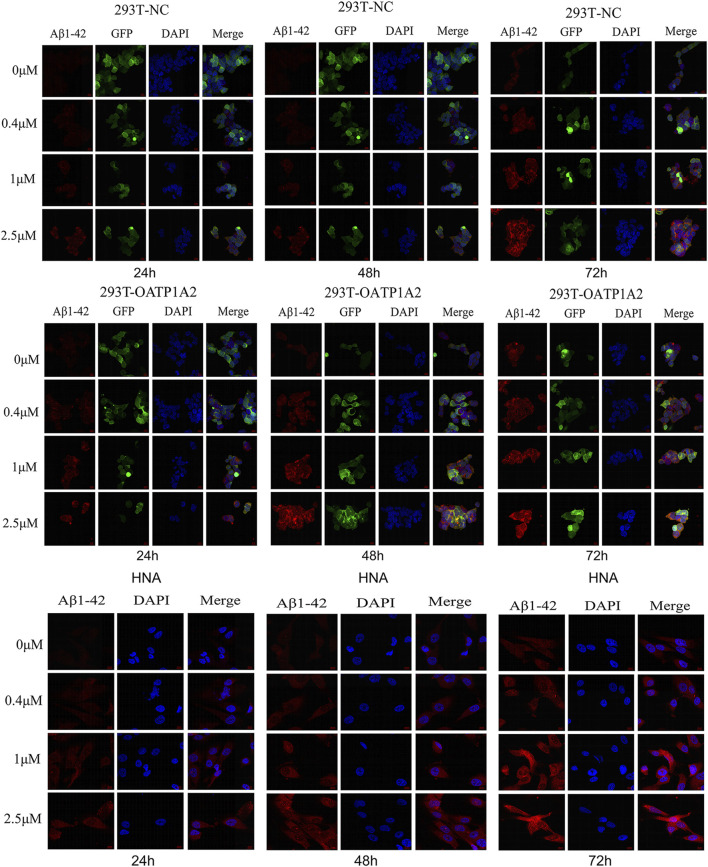
FIGURE 3.
The fluorescence intensity of Aβ1-42 gradually increased over time (24–72 h) and concentration (0 μM, 0.4 μM, 1 μM, 2.5 μM) in HEK293T-NC cells, HEK293T-OATP1A2 cells, and human astrocytes. HEK293T-OATP1A2 cells exhibited significantly higher fluorescence intensity of Aβ1-42 compared to HEK293T-NC cells under the same conditions. In comparison to human astrocytes, the fluorescence intensity of Aβ1-42 in HEK293T-OATP1A2 cells was significantly higher at concentrations of 0.4 μM and 1 μM, whereas at 2.5 μM, the fluorescence intensity was equivalent after 72 h of incubation. HNA: human astrocytes.

