
Figure 6. Analysis of antibody-dependent cellular cytotoxicity (ADCC) activity.
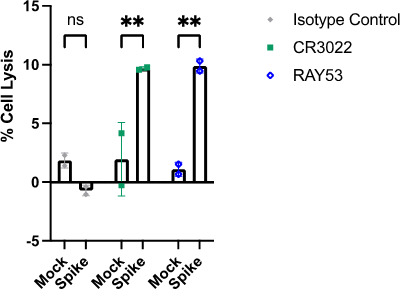
ADCC activity (percentage target cell lysis) is compared between mock and spike-expressing target cells for an isotype antibody (grey), control antibody CR3022 (green), and RAY53 (blue). Two-way ANOVA was performed to compare samples with spike-displaying cells or mock-transfected cells for each antibody. ** denotes p < 0.1; ns, not significant. Figure from (Silva et al., 2023).