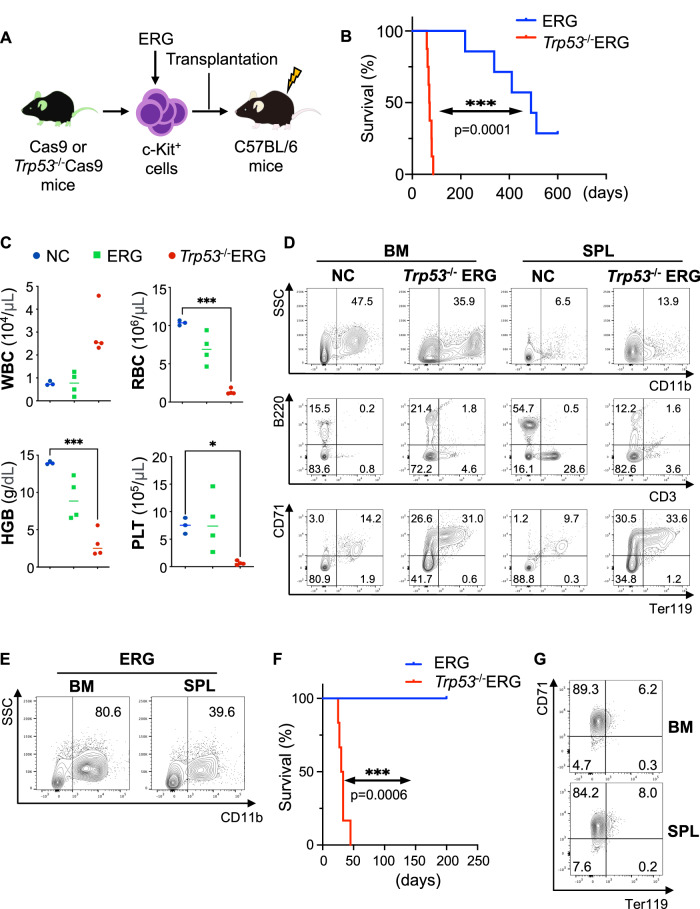
Fig. 3. Trp53 deficiency and ERG overexpression induce murine AEL.
A Experimental scheme used in (B–E). B Kaplan–Meier survival curves of mice transplanted with ERG-expressing cells (n = 7) or Trp53−/−ERG-expressing cells (n = 8) are shown. C White blood cell (WBC), red blood cell (RBC), hemoglobin (Hb) and platelet (PLT) count in the negative control (NC: normal C57BL/6 mice, n = 3) mice and in the mice transplanted with ERG-expressing cells (ERG, n = 4) or Trp53−/−ERG-expressing cells (Trp53−/−ERG, n = 4) 8 weeks after transplantation. *P < 0.05, ***P < 0.001. D Flow cytometric analysis of bone marrow (BM) and spleen (SPL) cells in the NC mice and mice transplanted with Trp53−/−ERG-expressing cells 8 weeks after transplantation. Quantified data are shown in Supplemental Fig. 3C. E Flow cytometric analysis of BM and SPL cells from mice transplanted with ERG-expressing cells 50 weeks after transplantation. F Kaplan–Meier survival curves of secondary recipient mice transplanted with ERG-expressing or Trp53−/−ERG-expressing spleen cells. G Flow cytometric analysis of BM and SPL cells in the secondary recipient mice transplanted with Trp53−/−ERG-expressing spleen cells 4 weeks after transplantation.

