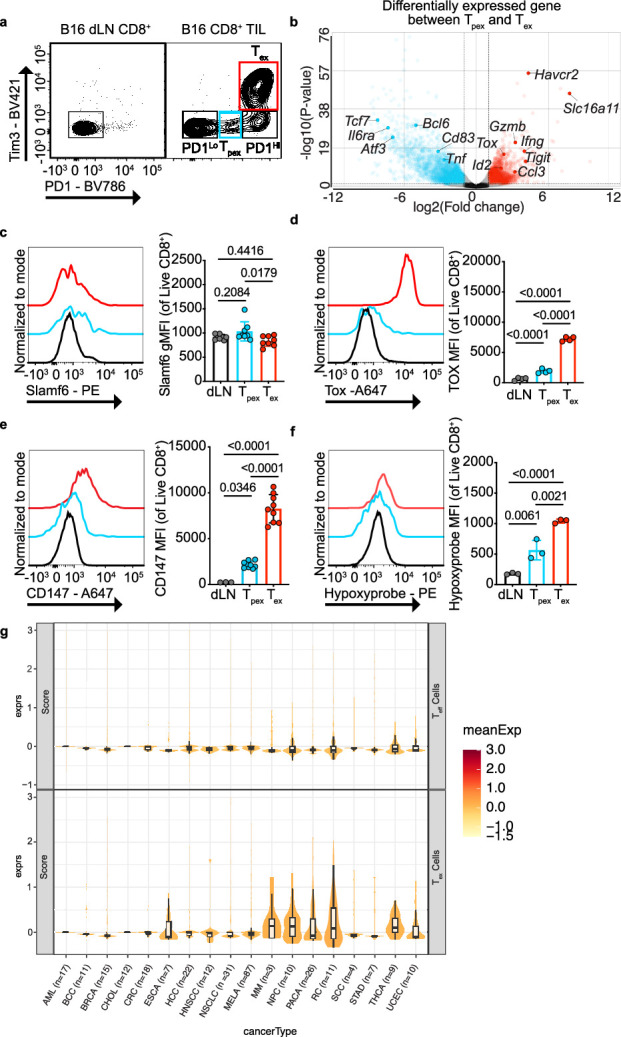
Extended Data Fig. 2. Terminally exhausted T cells differentially express solute carriers.

a) Representative flow cytometry plot of PD1 and Tim3 expression on CD8+ T cells in day 14 B16 tumors and dLNs. b) Volcano plot of differentially expressed genes in progenitor vs terminally exhausted T cells. c) Representative histogram and quantification of Slamf6 expression in B16 dLN CD8+ T cells, and B16 tumor infiltrating Tpex and Tex (n = 8 for all groups). d) Representative histogram and quantification of Tox expression in B16 dLN CD8+ T cells (n = 4), and B16 tumor infiltrating Tpex (n = 4) and Tex cells (n = 4). e) Representative histogram and quantification of CD147 expression in dLN CD8+ (n = 3), and B16 tumor infiltrating Tpex (n = 9) and Tex cells (n = 9). f) Representative histogram and quantification of hypoxyprobe staining in B16 dLN CD8+ T cells (n = 3), and B16 tumor infiltrating Tpex (n = 3) and Tex cells (n = 3). g) Expression of SLC16A11 from single cell analysis in human effector and Tex cells in various human tumors. Data represent one (d,f) or two (c,e) independent experiments. Error bars indicate +/− standard error of mean (SEM). Statistical analysis performed by one way analysis of variance (ANOVA) with Tukey’s multiple comparisons test (c-f).
