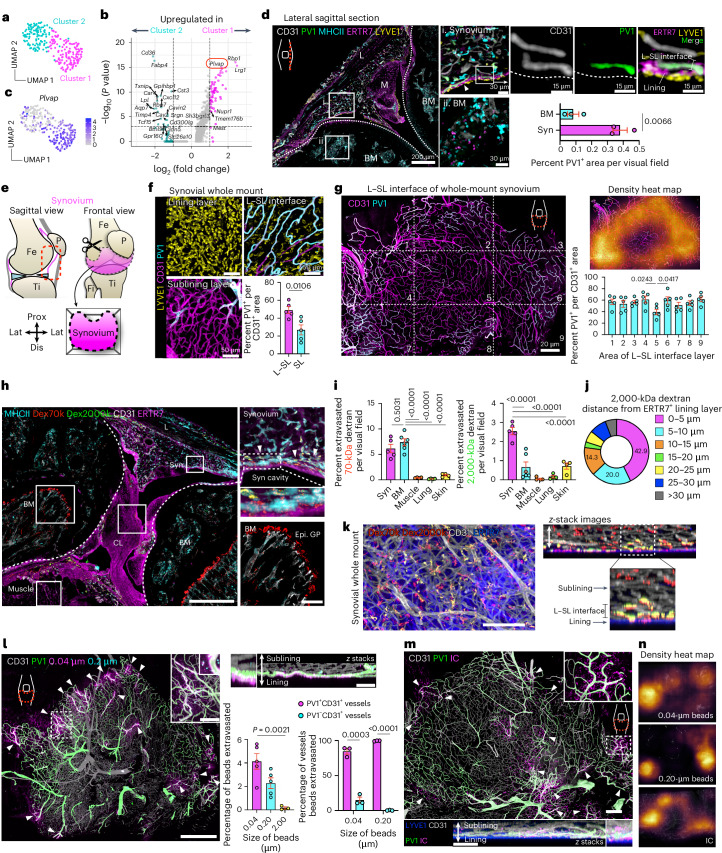
Fig. 1. PV1+ fenestrated capillaries in the L–SL interface at the peripheral area of the synovium allow circulating stimuli to access the synovium.
a, Uniform manifold approximation and projection (UMAP) visualization of synovial capillary endothelial cells extracted from CD31+ endothelial cells (Extended Data Fig. 1a,b). scRNA-seq data are from GSE145286. b, Volcano plots showing DEGs between two clusters of synovial capillary endothelial cells. c, UMAP visualization of synovial capillary endothelial cells expressing Plvap. Color bar shows the expression level. d, Representative confocal images of sections of knee joints; BM, bone marrow; M, meniscus; L, patella ligament; Syn, synovium; n = 3 mice for each group. e, Schematic diagram showing the protocol to dissect whole synovium from knee joints. The red dashed outline indicates the area of synovium dissected. Fe, femur; Ti, tibia; P, patella; Fi, fibula; Prox, proximal; Lat, lateral; Dis, distal. f, Three-dimensional reconstruction of representative confocal images of the indicated layer of whole-mount synovium. Quantification of the PV1+ area among CD31+ area at the indicated layers is shown on the bottom right; n = 5 mice for each group. g, Three-dimensional reconstruction of representative confocal images and density map of the L–SL interface of whole-mount synovium. Quantification of the PV1+ area among CD31+ area at the indicated compartments is shown on the bottom right; n = 5 mice. h, Representative confocal images of sections of knee joints from WT mice injected i.v. with 70- and 2,000-kDa dextran (300 μg of 70-kDa dextran (Dex70k) and 150 μg of 2,000-kDa dextran (Dex2000k)) 1 h before analysis. Arrowheads indicate the area where 70- and 2,000-kDa dextran merged; CL, cruciate ligament; Epi. GP, epiphyseal growth plate; scale bars, 500 and 100 μm (inset). i, Quantification of the extravasated area in each tissue; n = 4 to 6 mice for each group. j, Pie graph showing the percentage of distance between 2,000-kDa dextran and the ERTR7+ lining layer of the synovium in the section images; n = 4 mice. k, Three-dimensional reconstruction of representative confocal images of whole-mount synovium from WT mice injected i.v. with 70- and 2,000-kDa dextran 1 h before analysis; scale bar, 100 μm. l, Three-dimensional reconstruction of representative confocal images of whole-mount synovium from WT mice injected i.v. with fluorescently labeled microbeads of different sizes (25 μl of each FluoSphere carboxylate-modified microsphere dissolved in PBS) 1 h before analysis. Arrowheads indicate the sites where microbeads extravasated; scale bars, 500 and 50 μm (inset). Quantification of the area and capillary microbeads extravasated is shown on the bottom right; n = 3 to 5 mice for each group. m, Three-dimensional reconstruction of representative confocal images of whole-mount synovium from WT mice injected i.v. with OVA–AF647;rabbit polyclonal anti-OVA (RaOVA) ICs (40 μg of OVA–AF647 + 150 μg of RaOVA) 2 h before analysis. Arrowheads indicate sites where ICs extravasated; scale bars, 200 and 100 μm (z-stack images). n, Density map of a three-dimensional reconstruction of representative confocal images of whole-mount synovium from WT mice injected i.v. with microbeads or ICs. Data in d, f and l (right) were analyzed by two-tailed t-test. The center compartment was used as a control group in one-way analysis of variance (ANOVA) with a Dunnett’s test for g. Data in i and l (left) were analyzed by one-way ANOVA with Tukey’s post hoc test, and data in b were analyzed by two-tailed Wilcoxon rank-sum test. Data in d, f, g, i and l are shown as mean ± s.e.m. Images in k, m and n are representative of at least three independent experiments with similar results.

