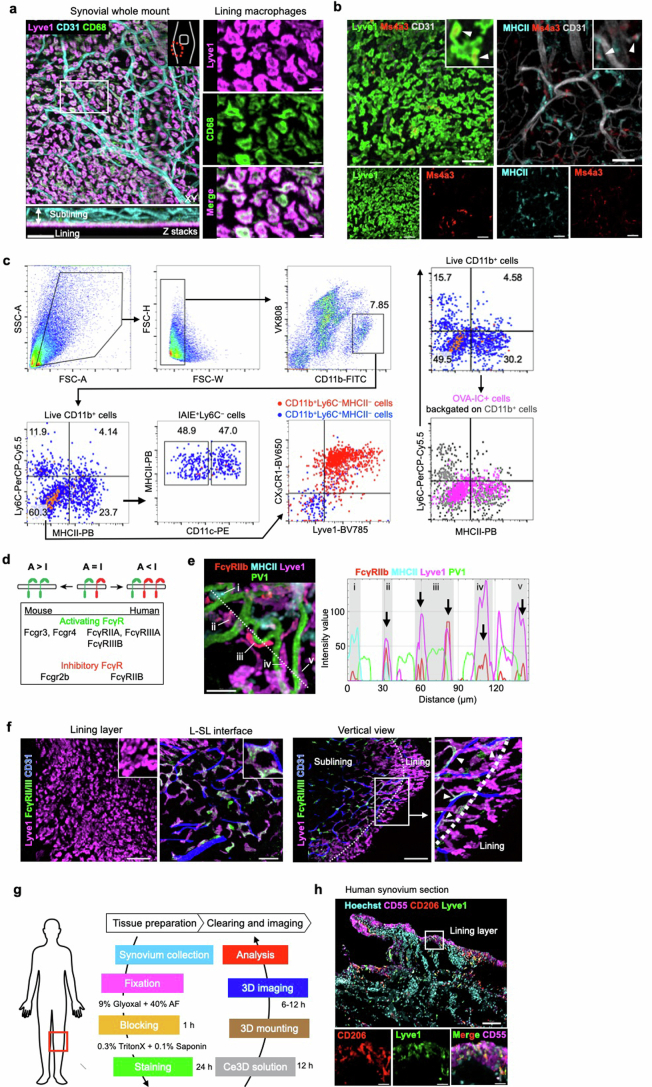
Extended Data Fig. 3. IC uptake and localisation of macrophages expressing FcγRII/lll in the synovium.
(a) 3D reconstruction of representative confocal images of whole mount synovium. Bars, 50 (left) and 10 μm (right). Images are representative of at least three independent experiments with similar results. (b) 3D reconstruction of representative confocal images of whole mount synovium from Ms4a3Cre-RosaTdT mice. Bars, 50 μm. (c) Gating strategy and flow cytometric analysis of OVA-IC uptake by synovial macrophages from wild type mice injected i.v. with OVA-AF647;RaOVA (40 μg OVA-AF647 + 150 μg RaOVA) 2 h prior to analysis. Plots are representative of 3 mice. (d) Schematic of FcγR A:I ratios. (e) Representative plot profile intensity of cells (right) as indicated by the white line shown in the 3D reconstruction of representative confocal images of L-SL interface of whole mount synovium (left), showing five representative cells consisting of MHCII+ cells and Lyve1+ cells. Images are representative of at least two independent experiments with similar results. (f) 3D reconstruction of representative confocal images of indicated layer of whole mount synovium. Bars, 50 μm. Arrowheads indicate FcγRll/lll+ area at L-SL interface. (g) Schematic depicting tissue preparation, clearing, and imaging protocol of human synovium. (h) Representative confocal images of sections of human synovium. CD55+ area represents lining fibroblasts. Bars, 100 and 20 μm. Images are representative of at least two independent experiments with similar results.

