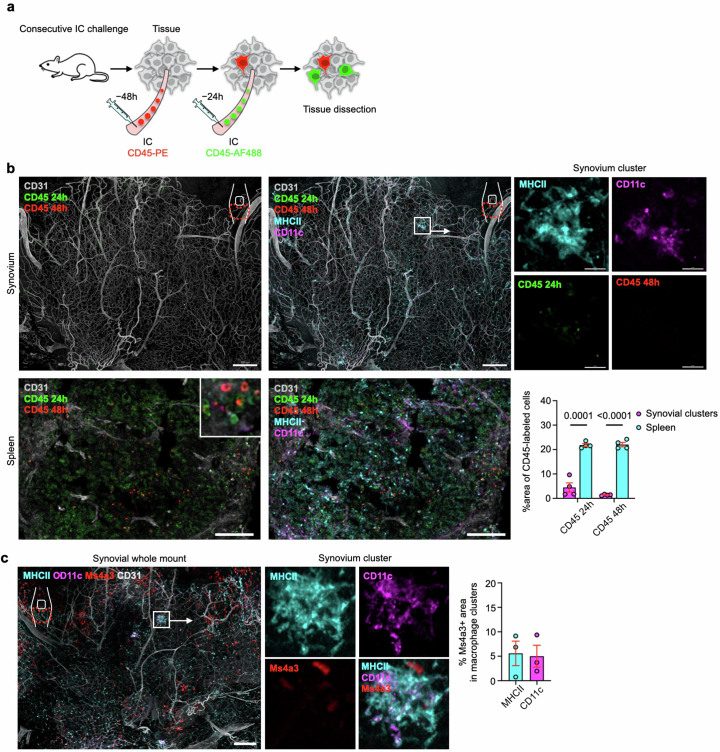
Extended Data Fig. 5. Monocyte contribution in the formation of MHCll+ macrophage clusters.
(a) Schematic depicting the experiment. (b) 3D reconstruction of representative confocal images of whole mount synovium and sectional images of spleen after IC and anti-CD45 antibody injection. Bars, 200 (synovium) and 100 μm (spleen). Data represents mean ± SEM. Two-tailed t test was used. (c) 3D reconstruction of representative confocal images of whole mount synovium from Ms4a3Cre-RosaTdT mice. Bars, 200 μm. Data represents mean ± SEM.

