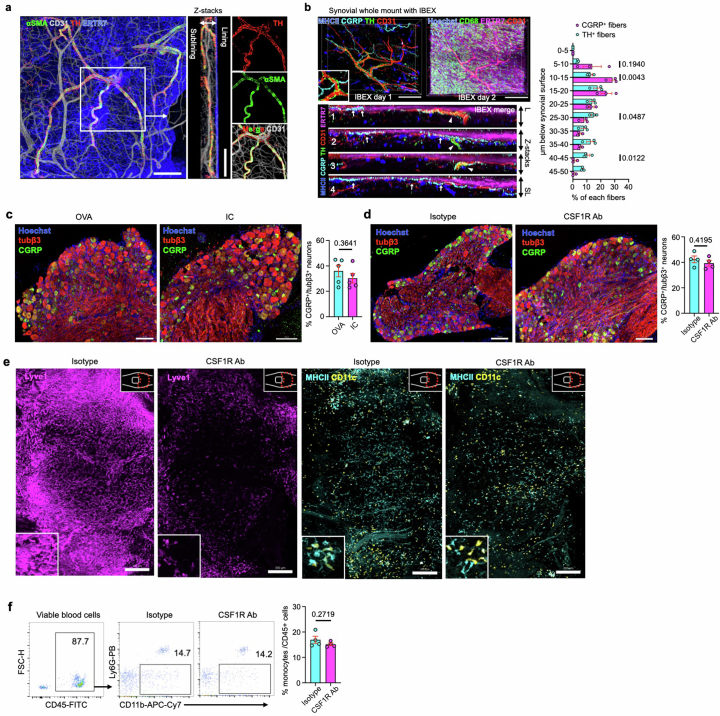
Extended Data Fig. 7. Distribution of TH+ and CGRP+ fibres in the synovium using IBEX.
(a) 3D reconstruction of representative confocal images of whole mount synovium stained for tyrosine hydroxylase (TH). Bars, 100 μm. Images are representative of at least three independent experiments with similar results. (b) 3D reconstruction of representative confocal images of iterative bleaching extends multiplexity (IBEX) of whole mount synovium. Bars, 100 μm. Four Z-stack images of IBEX of whole mount synovium (bottom). Quantification of the penetration depth of CGRP+ and TH+ fibres as a percentage among total fibres for each subset (right). n = 3 mice for each group. (c) Representative confocal images of L4 dorsal root ganglia (DRG) from mice intravenously injected with OVA or IC. Bars, 100 μm. n = 5 mice for each group. (d) Representative confocal images of L4 DRG from mice intraperitoneally injected with isotype control or anti-CSF1R antibody. Bars, 100 μm. n = 4 mice for each group. (e) Enlarged images for each macrophage subset in Fig. 6e. (f) Flow cytometry plot showing the number of monocytes from mice intraperitoneally injected with isotype control or anti-CSF1R antibody 72 h prior to assessment. Data represents mean ± SEM and two-tailed t test was used for in b, c, d, f.

