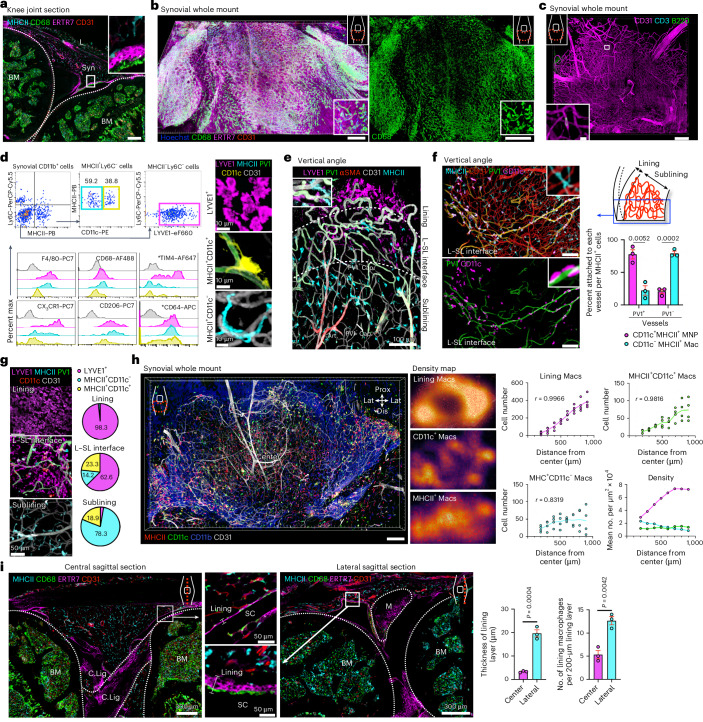
Fig. 2. Three subsets of macrophages with distinct distribution patterns line synovial PV1+ capillaries.
a, Representative confocal images of sections of healthy knee joints; BM, bone marrow; Syn, synovium; L, patella ligament; scale bar, 200 μm. b, Three-dimensional reconstruction of representative confocal images of whole-mount synovium; scale bars, 200 (left) and 300 μm (right). c, Three-dimensional reconstruction of representative confocal images of whole-mount synovium; scale bars, 200 and 10 μm. d, Gating strategy and flow cytometric analysis of three subsets of synovial macrophages with indicated cell surface markers. Shaded regions indicate staining with isotype controls. Data are representative of at least two independent experiments with similar results. The asterisks (*) indicate that fluorophores for LYVE1 were changed to apply the indicated antibodies. Representative confocal images of each subset of macrophages are shown on the right. e, Three-dimensional reconstruction of representative confocal images of whole-mount synovium from a vertical angle. The two dashed lines are (1) the border of lining layer and L–SL interface, and (2) L–SL interface and sublining layer. Cap., capillary; Art., arteriole. f, Three-dimensional reconstruction of representative confocal images of whole-mount synovium from a vertical angle; scale bars, 100 μm. Quantification of the percentage of CD11c+MHCII+ and CD11c–MHCII+ macrophages (Mac) attached to PV1+CD31+ or PV1−CD31+ vessels; n = 3 mice for each group. Data represent mean ± s.e.m. g, Three-dimensional reconstruction of representative confocal images at the indicated layers of whole-mount synovium. The pie graphs show the percentages of the three types of macrophages in the indicated layers of the synovium; n = 3 mice. h, Three-dimensional reconstruction of representative confocal images of whole-mount synovium (left) and density maps of three subsets of macrophages (middle); scale bar, 200 μm. The numbers and densities of each macrophage type in the indicated compartment of the synovium are shown on the right; n = 4 mice for each group. i, Representative confocal images of sections of healthy knee joints; M, meniscus; C.Lig, crescent ligament; SC, synovial cavity; n = 3 mice for each group. Data represent mean ± s.e.m. Data in f and i were analyzed by two-tailed t-test. Images in a–e are representative of at least two independent experiments with similar results.

