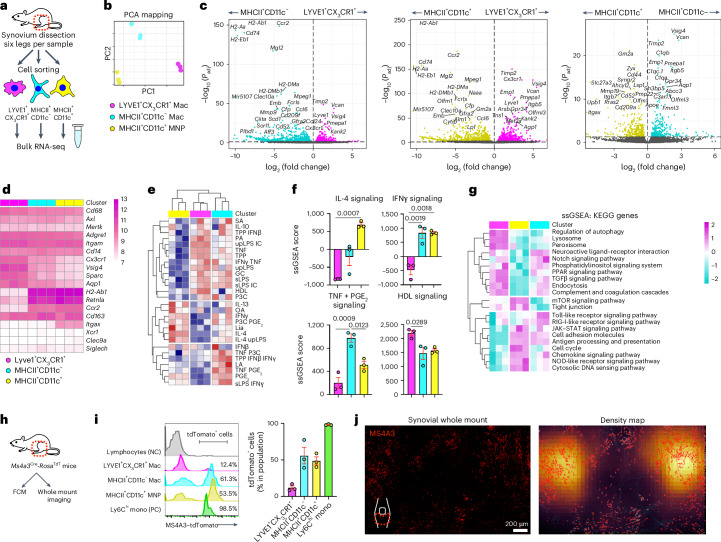
Fig. 3. Three subsets of synovial macrophages show distinct transcriptomes and ontogenies.
a, Illustration of the experimental protocol. b, Principal component analysis (PCA) of three subsets of synovial macrophages by RNA-seq; n = 3 mice for each plot and n = 9 mice for each population. c, Volcano plots showing DEGs between LYVE1+CX3CR1+, MHCII+CD11c− and MHCII+CD11c+ macrophages from WT mice; Padj, adjusted P value. d, Heat map of the expression of canonical macrophage genes (normalized values) and dendritic cell markers in LYVE1+CX3CR1+, MHCII+CD11c− and MHCII+CD11c+ macrophages from bulk RNA-seq analysis. e, Heat map of single-sample gene set enrichment analysis (ssGSEA) of three synovial macrophage subsets by RNA-seq. The signature genes from a previously published dataset (Xue et al.27) describing the transcriptional programs activated with 28 different stimuli were used; TPP, TNF+PGE2+P3C; IFN, interferon; PA, palmitic acid; LPS, lipopolysaccharide; TNF, tumor necrosis factor; GC, glucocorticoid; HDL, high-density lipoprotein; P3C, Pam3CysSerLys4; OA, oleic acid; Lia, linoleic acid; LA, lauric acid; sLPS, standard lipopolysaccharide; upLPS, ultrapure lipopolysaccharide. f, Quantification of ssGSEA scores for signaling pathways of the indicated stimuli for each subset; n = 3 mice for each plot and n = 9 mice for each population. Data represent mean ± s.e.m. g, Heat map of ssGSEAs of three synovial macrophage subsets with KEGG enrichment analysis (scaled normalized values). h, Illustration of the experimental protocol; FCM, flow cytometry. i, Flow cytometric analysis of MS4A3–tdTomato positivity of the indicated macrophage subsets from 10-week-old mice; n = 3 mice for each group. Data represent mean ± s.e.m.; NC, negative control; mono, monocytes; PC, positive control. j, Three-dimensional reconstruction of representative confocal images of whole-mount synovium and density map of MS4A3–tdTomato. Images are representative of three animals with similar results. Data in f were analyzed by one-way ANOVA with Tukey’s post hoc test, and data in c were analyzed by Wald test.

