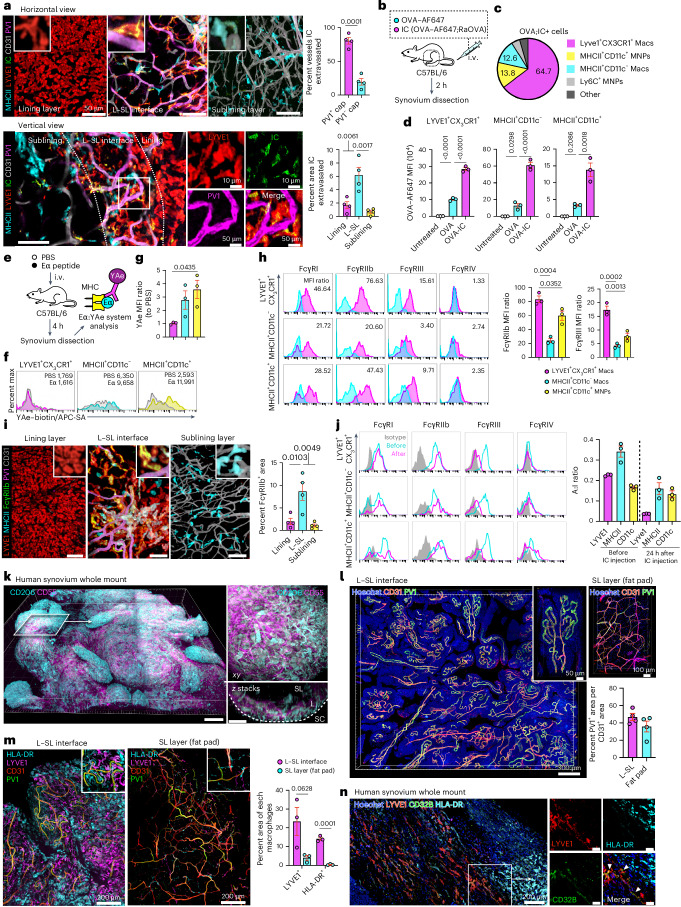
Fig. 4. Synovial macrophages sample circulating ICs, and MHCII+ macrophages present antigens.
a, Three-dimensional reconstruction of representative confocal images of the indicated layers and vertical views of whole-mount synovium from WT mice injected i.v. with OVA–AF647;RaOVA (40 μg of OVA–AF647 + 150 μg of RaOVA) 2 h before analysis. Quantification of the percentage of OVA-IC+ area within PV1+ and PV1−CD31+ area and the percentage of OVA-IC+ area in the lining layer, L–SL interface and sublining layer is shown on the right; n = 4 mice for each group. b, Schematic diagram showing the protocol. c, Pie graph showing the mean percentage of OVA-IC+ macrophage subsets among all OVA-IC+ cells; n = 3 mice. d, Scatter plots of mean fluorescence intensity (MFI) of OVA–AF647 and OVA–AF647;RaOVA; n = 3 mice for each group. e, Schematic diagram showing the protocol of antigen presentation in vivo using the Eα:YAe system. f,g, Flow cytometric analysis (f) and quantification (g) of YAe MFI of the indicated macrophage subsets from mice injected i.v. with Eα divided by that observed in macrophages from mice injected with PBS. Shaded regions indicate mice injected with PBS control; n = 3 mice for each group. h, Flow cytometric analysis of different types of synovial macrophages with indicated FcγRs. Cyan regions indicate staining with isotype controls. Scatter plots show the MFI ratio of each FcγR and isotype controls on each subset; n = 3 mice for each group. i, Three-dimensional reconstruction of representative confocal images of the indicated layers of whole-mount synovium; scale bars, 50 μm. Quantification of the percentage of FcγRllb+ area in the indicated layers is shown on the right; n = 4 mice for each group. j, Flow cytometric analysis of different types of synovial macrophages with the indicated FcγRs before and 24 h after IC injection. Gray regions indicate staining with isotype controls. The FcγR A:I ratios were calculated according to MFI ratios of activating (FcγRlll and FcγRlV) and inhibitory FcγRllb before and 24 h after IC injection on each subset; n = 3 mice for each group. k, Three-dimensional reconstruction of representative confocal images of whole-mount human synovium; scale bars, 100 (left) and 30 μm (right); L, lining layer; SL, sublining layer; SC, synovial cavity. l, Three-dimensional reconstruction of representative confocal images of whole-mount human synovium. Quantification of PV1+ area among CD31+ area in each layer; n = 3 individuals for each group. m, Three-dimensional reconstruction of representative confocal images of whole-mount human synovium. Quantification of LYVE1+ and HLA-DR+ area in the visual field is shown on the right; n = 3 individuals for each group. n, Three-dimensional reconstruction of representative confocal images of whole-mount human synovium; scale bars (right), 100 μm. Images are representative of at least two independent experiments with similar results. The arrowheads indicate the merged area for LYVE1 and CD32B. Data in a and m were analyzed by two-tailed t-test, and data in d and g–i were analyzed by one-way ANOVA with Tukey’s post hoc test. Data in a, d, g–j, l and m are shown as mean ± s.e.m.

