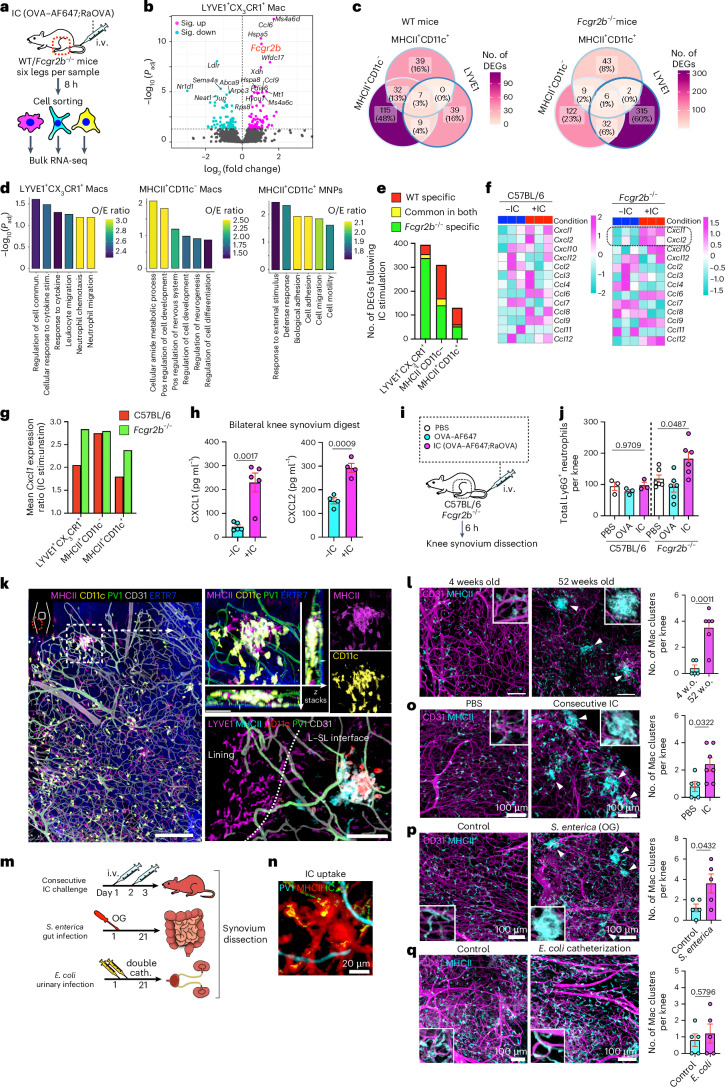
Fig. 5. Systemic IC challenge induces distinct responses in synovial macrophage subsets.
a, Schematic diagram showing the protocol for bulk RNA-seq. b, Volcano plot showing DEGs due to OVA-IC stimulation in LYVE1+CX3CR1+ macrophages from WT mice by RNA-seq; Sig., significantly. c, Venn diagram showing the number of common DEGs affected by IC stimulation between LYVE1+CX3CR1+, MHCII+CD11c− and MHCII+CD11c+ macrophages in WT and Fcgr2b−/− mice. d, Gene ontogeny (GO) analysis of DEGs specific to each macrophage type with all the DEGs of three macrophage subsets as the background gene list; commun., communication; stim., stimulation; Pos, positive; O/E, observed/expected. e, Number of DEGs in each synovial macrophage from WT and Fcgr2b−/− mice and common DEGs in both strains. f, Heat map of the expression of chemokines (scaled normalized values) with or without IC injection in LYVE1+CX3CR1+ macrophages from WT and Fcgr2b−/− mice. g, Ratio of mean Cxcl1 expression in LYVE1+CX3CR1+, MHCII+CD11c− and MHCII+CD11c+ macrophages from WT and Fcgr2b−/− mice injected i.v. with or without ICs; stim/unstim, stimulated/unstimulated. h, CXCL1 and CXCL2 enzyme-linked immunosorbent assay (ELISA) of the synovial digestion from Fcgr2b−/− mice with or without IC injection; n = 5 (CXCL1) and 4 (CXCL2) mice for each group. i, Schematic diagram showing the protocol. j, Flow cytometry quantification of synovial neutrophils (Ly6G+ gates) from WT and Fcgr2b−/− mice injected i.v. with PBS, OVA or OVA;RaOVA 6 h before analysis; n = 3 (WT) and n = 6 (Fcgr2b−/−) mice. k, Three-dimensional reconstruction of representative confocal images of whole-mount synovium depicting an MHCII+ macrophage cluster around PV1+ capillaries; scale bars, 200 (left), 50 (top right) and 100 μm (bottom right). Images are representative of at least two independent experiments with similar results. l, Number of MHCII+ macrophage clusters with a diameter of >30 μm in the whole-mount synovium in 4- and 52-week-old mice; n = 5 (4-week-old) and 6 (52-week-old) mice; w.o., weeks old; scale bars, 100 μm. m, Schematic diagram showing the protocol of systemic challenges. n,o, Number and images of MHCII+ macrophage clusters with a diameter of >30 μm in the whole-mount synovium in mice injected i.v. with PBS or OVA-IC over 2 consecutive days and analyzed 24 h after the last injection; n = 5 and 7 mice for each group. p, Number of MHCII+ macrophage clusters in mice infected orally with PBS or 5 × 10⁶ S. enterica serovar Typhimurium and analyzed after 3 weeks; n = 5 mice for each group; OG, oral gavage. The arrowheads in l, o and p mark macrophage clusters. q, Number of MHCII+ macrophage clusters in mice inoculated with two doses of 4 × 10⁷ uropathogenic E. coli into the bladder and analyzed after 3 weeks; n = 5 mice for each group. Data in h, l and o–q were analyzed by two-tailed t-test, data in j were analyzed by one-way ANOVA with Tukey’s post hoc test, and data in b were analyzed by Wald test. Data are shown as mean ± s.e.m. in h, j, l and n–q.

