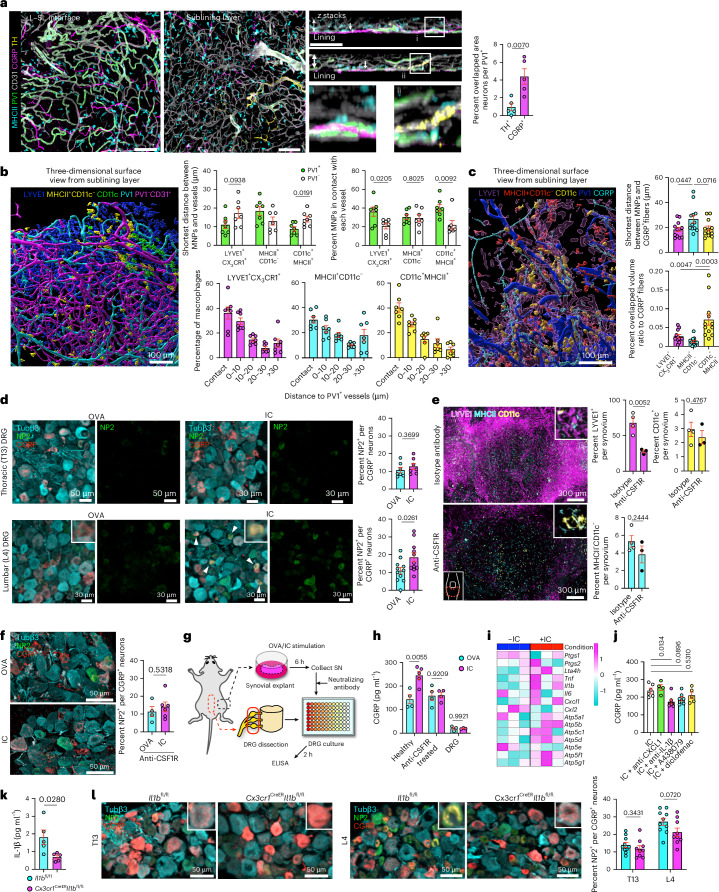
Fig. 6. Synovial macrophages activate nociceptors in part through IL-1β.
a, Three-dimensional reconstruction of representative confocal images of whole-mount synovium; scale bars, 100 μm. Arrows indicate CGRP+ neurons in z-stack images; n = 5 mice for each group. b, Three-dimensional reconstruction of representative confocal images of whole-mount synovium using the Surface module in Imaris and quantification of the distance between each macrophage subset and vessels; n = 7 mice for each group. Each plot indicates the mean value of each mouse. c, Three-dimensional reconstruction of representative confocal images of whole-mount synovium using the Surface module in Imaris and quantification of the distance or overlapped volume ratio between each macrophage subset and CGRP+ fibers; n = 12 mice for each group. Each plot indicates the mean value of each mouse. d, Representative confocal images of lumbar (L4) and thoracic (T13) DRG in mice injected i.v. with OVA or OVA-IC and analyzed after 6 h; n = 7 (T13) and 11 (L4) mice for each group; Tubβ3, tubulin-β3. The arrowheads indicate the merged area for NP2 and CGRP. e, Three-dimensional reconstruction of representative confocal images of whole-mount synovium from mice injected intraperitoneally (i.p.) with 400 μg of anti-CSF1R or isotype control antibody and analyzed after 72 h. Quantification of the percentage of area covered by each macrophage subset in the synovium is shown on the right; n = 4 (isotype) and 3 (anti-CSF1R) mice. f, Representative confocal images of L4 DRG in mice injected i.v. with OVA or OVA-IC 72 h after i.p. injection with 400 μg of anti-CSF1R; n = 4 (OVA) and 6 (IC) mice. g, Illustration of experimental protocol; SN, supernatant. h, CGRP ELISA of DRG culture SN stimulated with SN from OVA- or IC-stimulated synovial explants from indicated mice or directly stimulated with OVA or IC; n = 3 to 5 mice for each group. i, Heat map of the expression of potential candidates responsible for immune-driven pain in bulk RNA-seq data from IC-stimulated LYVE1+CX3CR1+ macrophages (scaled normalized values). j, CGRP ELISA of DRG culture supernatants stimulated with supernatants from IC-stimulated synovial explants. Indicated neutralizing antibodies (4 μg ml–1) or A438079 (100 μM) was added to synovial SN before adding to DRG neurons. Diflofenac (200 μM) was added with IC when stimulating synovial explants; n = 6 (IC), 4 (CXCL1), 7 (IL-1β), 7 (A438079) and 5 (Coxi) mice. k, IL-1β concentration of the synovial digestion measured by cytometric bead array from Il1bfl/fl and Cx3cr1CreERIl1bfl/fl mice 12 h after i.p. injection of 2 mg per kg (body weight) lipopolysaccharide (LPS); n = 5 mice for each group. l, Representative confocal images of T13 and L4 DRG in Il1bfl/fl and Cx3cr1CreERIl1bfl/fl mice injected i.v. with OVA-IC. Mice were i.p. injected with tamoxifen twice 48 h apart 2 weeks before IC injection and analyzed 6 h after IC injection; n = 10 (Il1bfl/fl) and 9 (Cx3cr1CreERIl1bfl/fl) mice. Data in a, b, d–f, h, k and l were analyzed by two-tailed t-test. The IC group was used as a control group in a one-way ANOVA with Dunnett’s post hoc test in j. Data in c were analyzed by one-way ANOVA with Tukey’s post hoc test. Data in a–f, h and j–l represent mean ± s.e.m.

