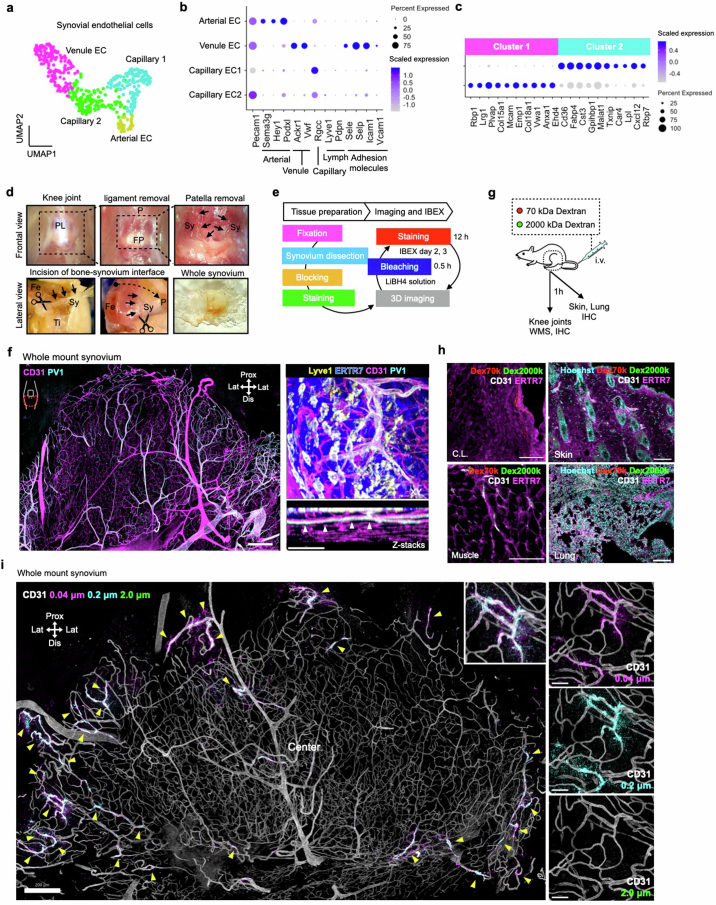
Extended Data Fig. 1. PV1+ capillaries with distinct molecular signatures localised at the L-SL interface of the synovium.
(a) Uniform manifold approximation and projection (UMAP) visualizations of Pecam1+ endothelial cells in synovium. ScRNA-seq data from GSE145286. (b) Dot plots showing the scaled gene expression and percentage of cells expressing genes for cell markers and adhesion molecules in endothelial cell populations from scRNA-seq analysis. (c) Top 10 differentially expressed genes between two cell populations in synovial capillary endothelial cells. (d) Anatomic localization of the synovium from the frontal view and dissection protocol from the lateral view. P: patella, PL: patella ligament, FP: fat pad, Sy: synovium, Fe: femur, Ti: tibia. (e) Schematic depicting tissue preparation, imaging and iterative bleaching extends multiplexity (IBEX) protocol. (f) 3D reconstruction of representative confocal images of whole mount synovium. Arrowheads indicate PV1+ capillaries at the lining-sublining (L-SL) interface (Z-stack images). Bars, 200 and 50 μm. Images are representative of at least three independent experiments with similar results. (g) Schematic diagram showing the protocol. (h) Representative confocal images of sections of skin and lung from wild type mice injected i.v. with 70 and 2000 kDa Dextran (300 μg 70 kDa Dextran and 150 μg 2000 kDa Dextran) 1 h prior to analysis. Images are representative of at least three independent experiments with similar results. (i) 3D reconstruction of representative confocal images of whole mount synovium from wild type mice injected i.v. with fluorescently labeled microbeads of different sizes 1 h prior to analysis. Arrows indicate the sites where microbeads extravasated. Bars, 200 and 50 μm. Images are representative of at least three independent experiments with similar results.

