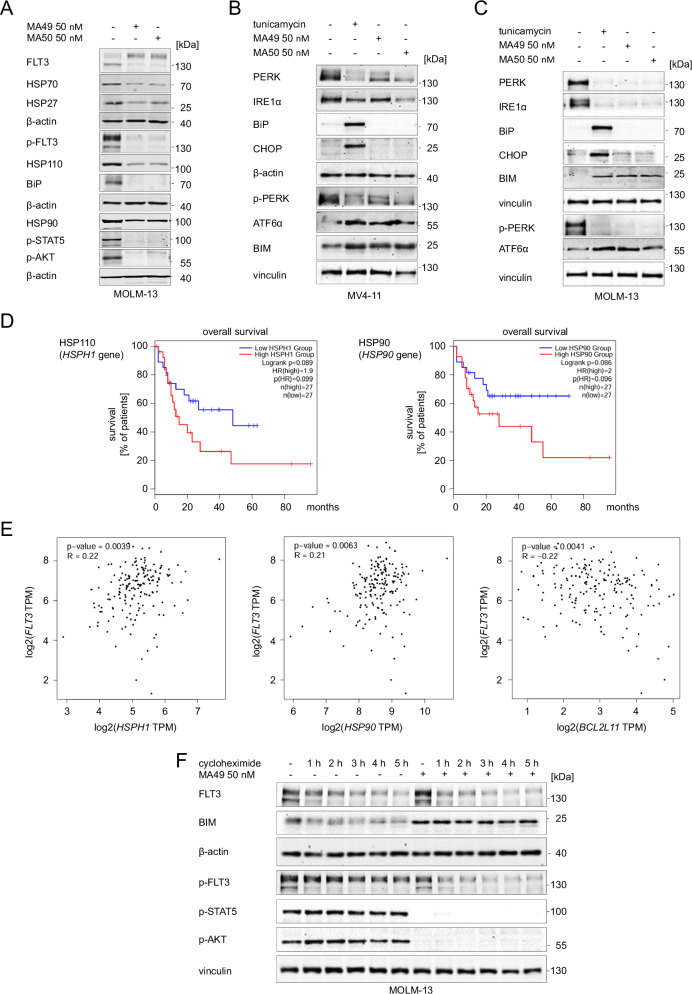
Fig. 4. MA49 and MA50 regulate heat shock- and ER-stress-related proteins in AML cells with FLT3-ITD.
A MOLM-13 cells were treated with 50 nM MA49 or MA50 for 24 h and analyzed by immunoblot for the expression of FLT3, HSP110, HSP90, HSP70, HSP27, BiP, pY591-FLT3, pY694-STAT5, and pS473-AKT. The protein levels of β-actin were determined to verify the equal loading of samples. The data are representative for the outcome of three independent experiments. B, C Immunoblot shows the expression of PERK, IRE1α, BiP, CHOP, pT982-PERK, BIM, and ATF6α (activated form upon cleavage in Golgi during ER stress) after treatment with 0.5 µg/ml tunicamycin or 50 nM MA49 or MA50 for 24 h in (B) MV4-11 or (C) MOLM-13 cells. The protein levels of β-actin or vinculin were determined to verify equal loading of samples. The data are representative for the outcome of two independent experiments; +, treated; -, untreated; p-, phosphorylated; kDa, molecular weight in kilodalton. D The GEPIA2 database was analyzed for a correlation between overall survival of AML patients and the levels of HSPs and ER stress proteins. We found significant associations of HSP110 (encoded by the HSPH1 gene) and HSP90 (encoded by the HSP90 gene) expression levels in leukemia cells and patient survival. The analysis included 54 patients in total, with 50% in the high and 50% in the low expressing groups (p = 0.089–0.086). E This database contains data showing an association of FLT3 gene expression and mRNA transcripts encoding HSP110, HSP90, and BIM (p = 0.0039–0.0063). Positive R values indicate positive coregulation of gene expression; negative R values indicate negative coregulation of gene expression; TPM, transcripts per million reads. The graphs show the Pearson correlation coefficients. Such correlation coefficients describe linear correlations between two sets of data. GEPIA2 uses the non-log scale for calculation and use the log-scale axis for visualization. F MOLM-13 cells were treated with 10 μg/ml cycloheximide +/− 50 nM MA49 for 1–5 h. Lysates were analyzed by immunoblot for the expression of FLT3, BIM, pY591-FLT3, pY694-STAT5, and pS473-AKT. The protein levels of β-actin or vinculin were determined to verify equal loading of samples; +, treated; -, untreated; p-, phosphorylated; kDa, molecular weight in kilodalton.

