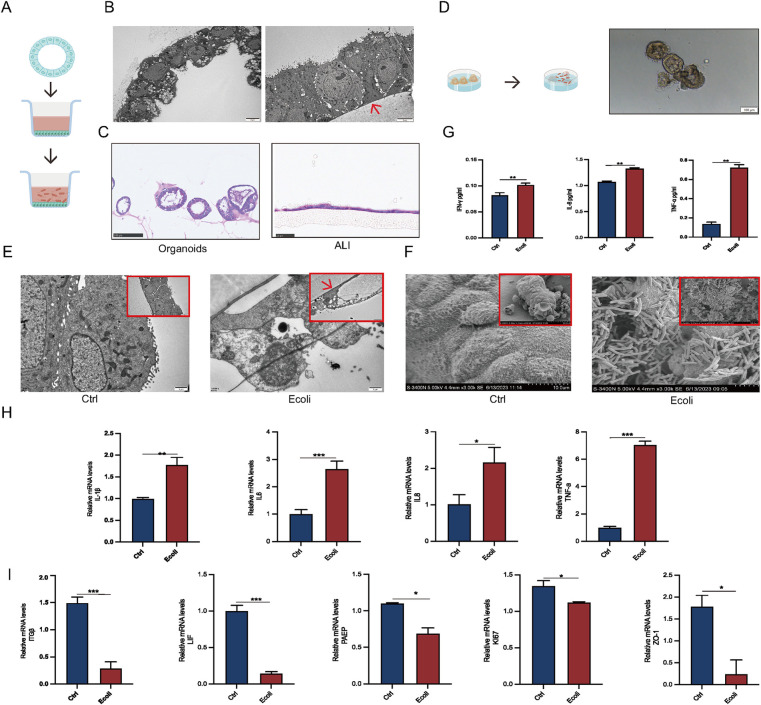
Figure 4.
Establishment of EEGO infection models. (A) Workflow for air-liquid interface (ALI) culture of EEGOs. (B) Scanning electron microscopy images comparing EEGOs before and after ALI culture. After ALI culture, the previously hollow, cystic structure of the EEGOs expanded into a single-layered columnar epithelium with nuclei located at the basal side. The red arrow indicates the ALI chamber membrane. Scale bar: 5 μm. (C) Hematoxylin and EEGOs in (H&E) staining of EEGOs show that after ALI culture, the organoids transformed from a spherical structure into a single-layered columnar epithelium. Organoid scale bar: 100 μm; ALI scale bar: 25 μm. (D) Workflow for direct infection of EEGOs with E. coli. Scale bar: 100 μm. (E) EEGOs after ALI culture and E. coli infection (Control vs. E. coli). Organoids show cell fragmentation and loss of intact morphology. The red arrow indicates the ALI chamber membrane. Scale bar: 1 μm. (F) EEGOs directly infected with E. coli. Scale bar: 10 μm. (G) ELISA assay of inflammatory factor expression. (H) RT-qPCR assay of mRNA expression of inflammatory factors. (I) RT-qPCR assay of mRNA expression of P4 hormone response genes, proliferation-related genes, and tight junction-related genes in organoids. The results shown are one of three independent experiments. Data are means ± SEMs. *P ≤ 0.05, **P ≤ 0.01, ***P ≤ 0.001.

