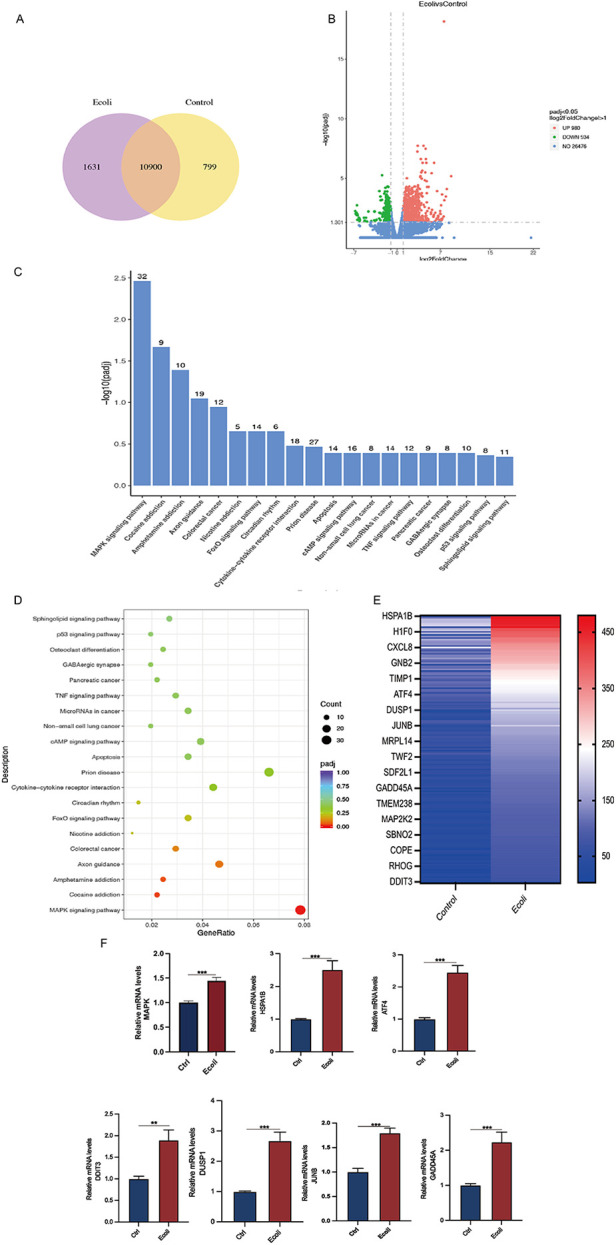
Figure 5.

Differential gene expression and pathway analysis in organoids infected with E. coli. (A) Venn diagram of co-expressed genes per comparison (E. coli vs. Control). The selection criteria were p < 0.05 and fold change contrast ≥ 2. (B) Volcano plots of differentially expressed genes, with 980 genes upregulated and 534 genes downregulated (E. coli vs. Control). (C) KEGG analysis of differentially expressed mRNA target genes. A bar chart of the top 20 KEGG pathways with upregulated genes is presented. KEGG: Kyoto Encyclopedia of Genes and Genomes. (D) Dot plot representing key signaling pathway changes in organoids post-infection. Dot size indicates the proportion of cells in the cluster expressing a gene, and shading indicates the relative level of expression (light to dark). (E) Hierarchical clustering comparing E. coli vs. Control of significantly regulated genes (2-fold, FDR P < 0.05). (F) RT-PCR of RNA isolated from organoid cultures treated as described in methods. Relative MAPK, HAPA1B, ATF4, DDIT3, DUSP1, JUNB, and GADD45A mRNA levels in E. coli-treated organoids. The results are shown as the mean ± SEMs of triplicate samples and are representative of three independent experiments. *P ≤ 0.05, **P ≤ 0.01, ***P ≤ 0.001.
