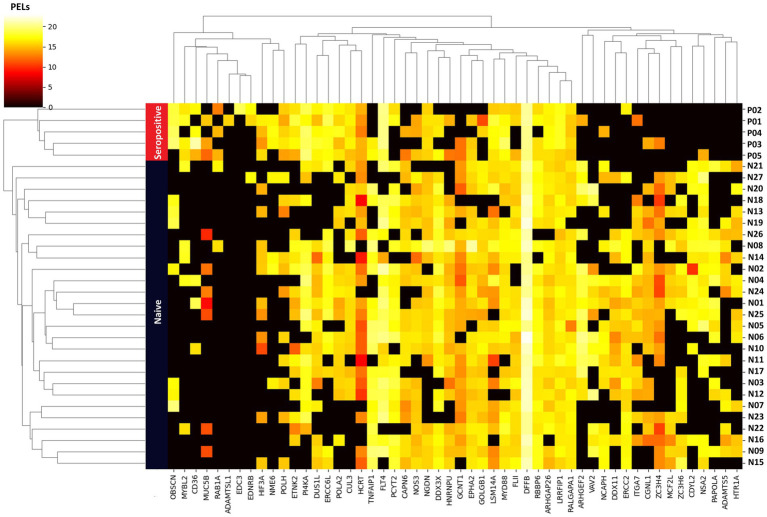
Figure 6.
Unsupervised hierarchical clustering heatmap analysis based on 52 important proteins as a feature. Vertical rows represent the 32 samples, with blue and red bands indicating samples from the naïve and seropositive groups, respectively. The 52 proteins are listed on the horizontal axis. The color gradient within the heatmap reflects the scale of protein expression level (PEL) for each sample, with colors indicating the range from low to high expression level.

