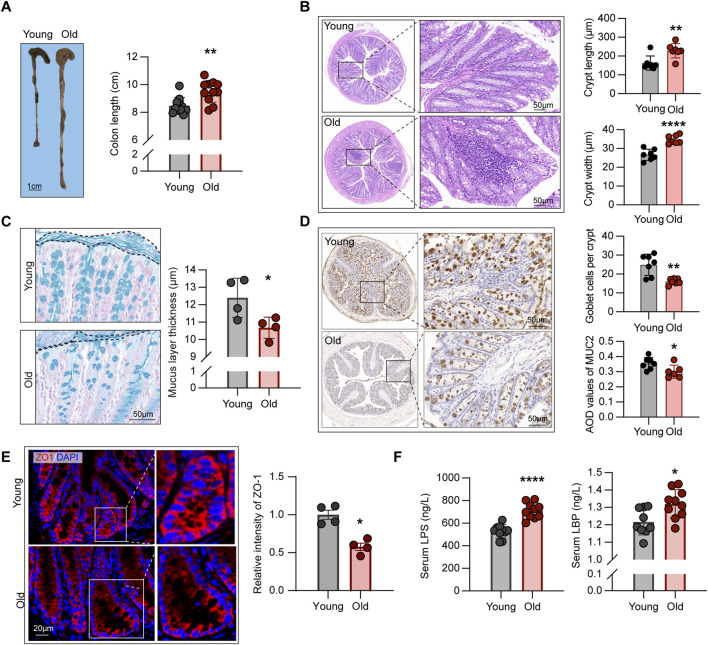
FIGURE 6.
Aging-related alterations in intestinal structural and barrier function. (A) Comparison of length from colon to anus between young and old mice (n = 11). (B) HE staining showing crypt structures in the intestines of young and old mice, with at least 30 complete crypts analyzed per mouse (n = 7). (C) Comparison of mucus layer thickness in the intestines between young and old mice (n = 4). (D) IHC staining for MUC2 protein in intestinal sections from young and old mice, with average optical density (AOD) used to quantify staining intensity (n = 6–7). (E) Expression levels of ZO-1 protein in the intestines of young and old mice, measured using relative fluorescence intensity for group comparison (n = 4). (F) Comparison of plasma endotoxin levels in young and old mice (n = 9–10). *P < 0.05, **P < 0.01, and ****P < 0.0001.

