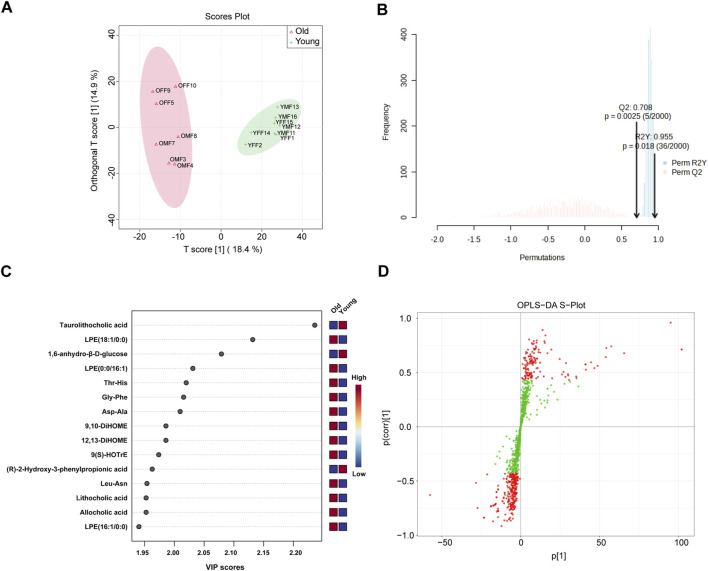
FIGURE 7.
OPLS-DA of widely targeted metabolomic profiling of intestinal contents from young and old mice using UPLC-MS/MS. (A) The distribution of each sample in the young and old groups; (B) Permutation testing of OPLS-DA. (C) Top 15 metabolites ranked by VIP values in the OPLS-DA; (D) S-plot of OPLS-DA.

