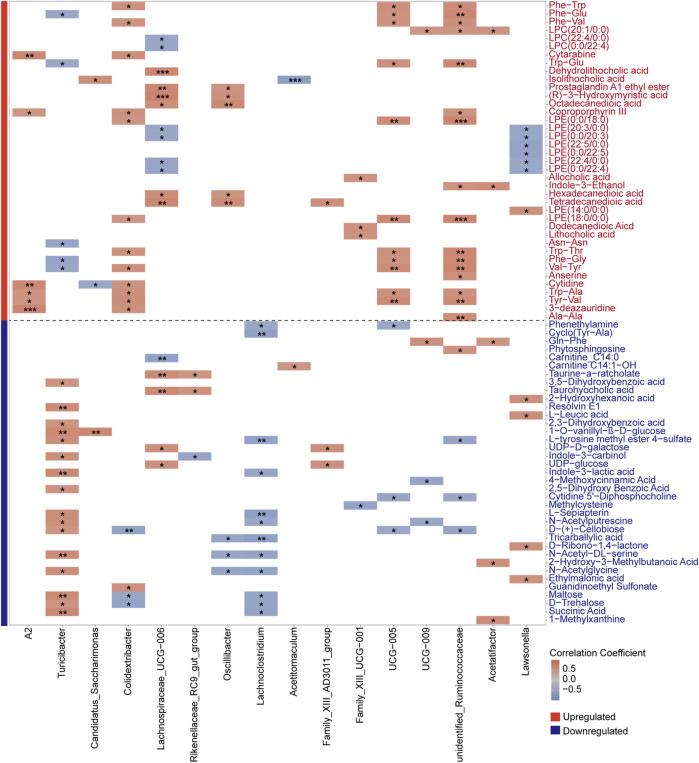
FIGURE 8.
Spearman correlation heatmap showing associations between aging-associated bacterial genera and both upregulated (red-labeled) and downregulated (blue-labeled) metabolites in old mice. Differential genera, defined by the results from LEfSe and the intersection of LinDA and Welch’s t-test, were analyzed with Bonferroni correction to identify robust correlations. Significant correlations are indicated by *P < 0.05, **P < 0.01, and ***P < 0.001, with color intensity reflecting correlation strength.

