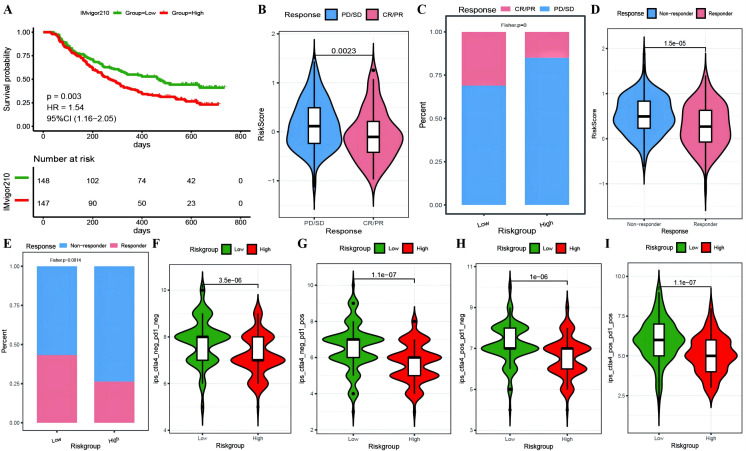
Figure 11.
Predictive modeling of immunotherapy efficacy via risk stratification. (A) Kaplan-Meier curves for high-risk versus low-risk groups within the IMvigor210 cohort; (B) Violin plots illustrating differences in risk scores between responder and non-responder groups within the IMvigor210 cohort, with responders depicted in red and non-responders in blue; (C) Bar graphs showing the cumulative distribution differences between responder and non-responder groups among high-risk and low-risk categories within the IMvigor210 cohort; (D) Violin plots of risk scores for responder versus non-responder groups as predicted by TIDE; (E) Bar graphs depicting the cumulative distribution of responder versus non-responder groups among model-based stratifications as forecasted by TIDE; (F–I) Violin plots representing the differences in IPS scores between high-risk and low-risk groups, with high-risk groups colored in red and low-risk groups in green.

