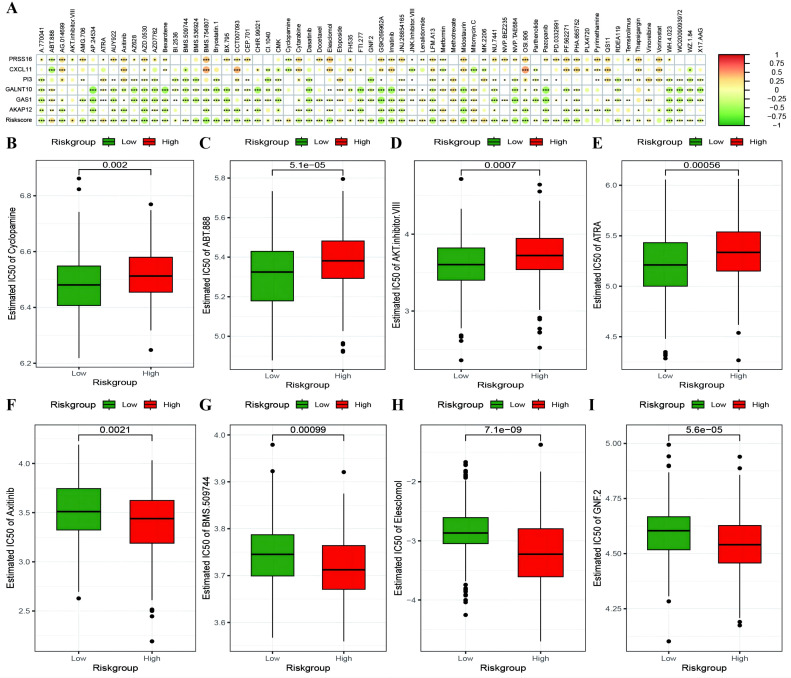
Figure 12.
Risk model predicts chemotherapy drug resistance. (A) Heatmap illustrating the correlation between IC50 values of drugs showing significant differences in sensitivity between high-risk and low-risk groups, model gene expression, and RiskScore. The intensity of the color indicates the level of correlation, with * denoting significance; (B–E) Box plots depicting differences in IC50 values for drugs to which high-risk groups are more sensitive, with high-risk groups in red and low-risk groups in green; (F–I) Box plots showing differences in IC50 values for drugs to which low-risk groups are more sensitive. *p < 0.05, **p < 0.001, ***p < 0.001.

