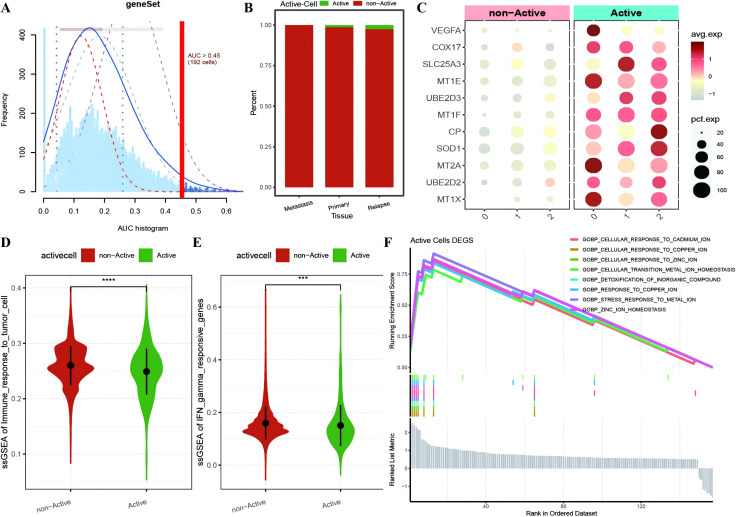
Figure 3.
Identification of active cuproptosis malignant cell population. (A) Single-cell AUC scores for ferroptosis genes, with the optimal threshold being 0.45; (B) Bar chart displaying the distribution of active populations in different tissue types, where red represents inactive populations and green represents active populations; (C) Bubble plot depicting the expression of ferroptosis marker genes in various malignant cell subtypes and different activity types, with a redder color indicating higher average expression values and the size of the dots representing the number of expressing cells; (D, E) Violin plots showing differences in immune function between active and non-active malignant cell populations with respect to ferroptosis activity, where green represents the active population and red represents the non-active population; (F) Line plot illustrating the enrichment results of differentially expressed genes between the active and non-active ferroptosis groups based on GOBP-GSEA. ***p < 0.001, ****p < 0.0001.

