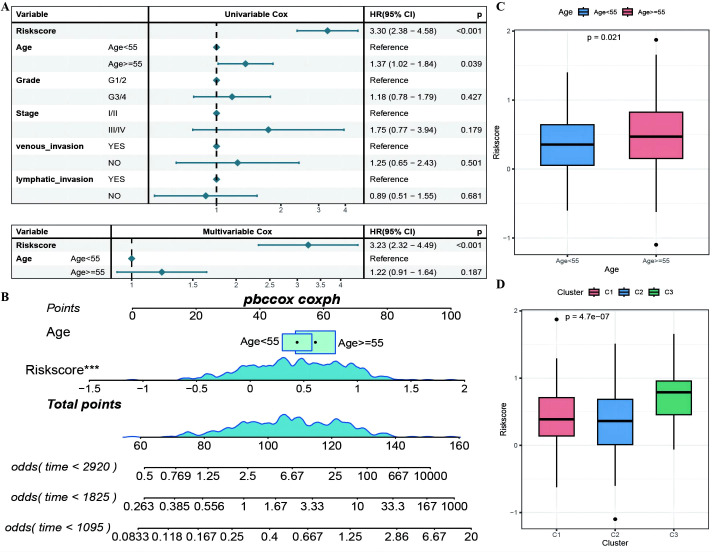
Figure 8.
The RiskScore as an independent prognostic factor. (A) Forest plot of the results of single- and multi-factor Cox analysis for clinical factors; (B) Nomogram of the predictive model, where the square plus line segment represents the contribution of each clinical factor to the outcome event, Total Points represents the total score obtained by adding up the scores for all variables, and the three lines at the bottom represent the 8/5/3-year survival probabilities corresponding to each value point; (C, D) Box plots showing the differences in risk scores distribution between different Age and molecular subtype groups, with different colors representing different groups, and the p-value indicating the significance of the difference. ***p < 0.001.

