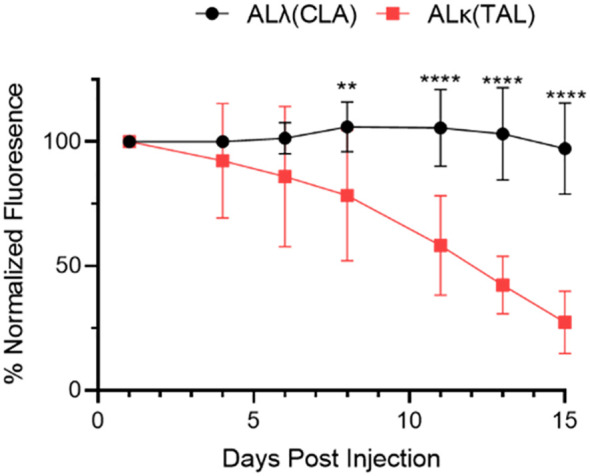
Figure 2.

Quantification of amyloidoma-associated Dylight800 fluorescence intensity as normalized fluorescence. Data are representative of 2 experiments with n=8-12 animals per group. Mean and standard deviation at each time point shown. Data were analyzed using Student’s t-test at each time point to determine significance **, p<0.01; ****, p<0.001.
