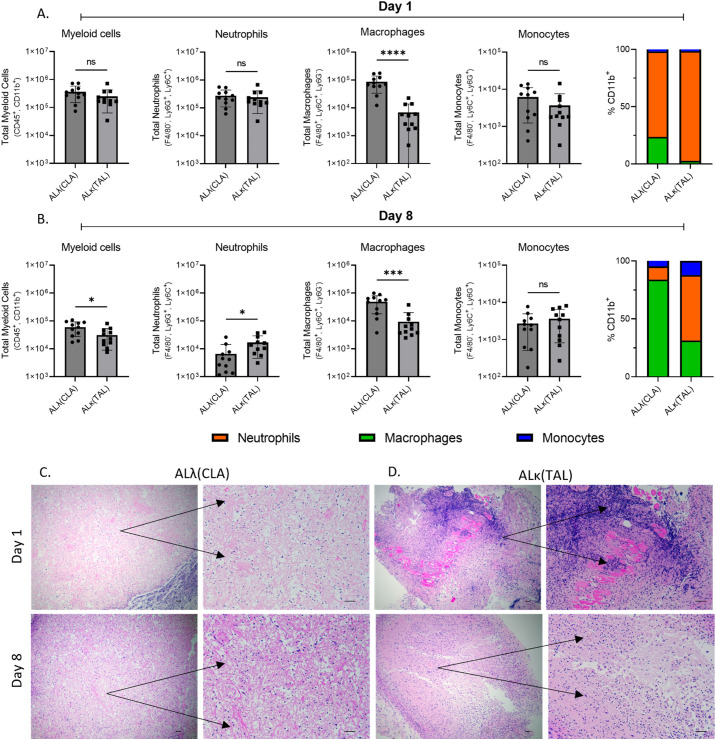
Figure 3.
Immunophenotypic evaluation of immune infiltrate into ALλ(CLA) or ALκ(TAL) amyloidomas. Flow cytometry was used to identify single cell suspensions isolated from indicated tissues Day 1 (A) and Day 8 (B) post amyloid implantation. Cell surface markers used to identify each indicated population are detailed on the y-axis of each panel. The gating strategy used for analysis can be found in Supplementary Figure 1 . Excised amyloidoma tissues sections were stained with H&E to identify immune cell infiltrates (C, D). Images are representative of 3-4 mice per group. Black scale bars represent 50μm. Data represent the mean ± standard deviation from one experiment which is representative of two experimental replicates, with n=5-6 animals per group per experiment. Statistical significance was determined by Student’s t test, ∗p < 0.05, ∗∗∗p < 0.001, ∗∗∗∗p < 0.0001. ns, not significant.

