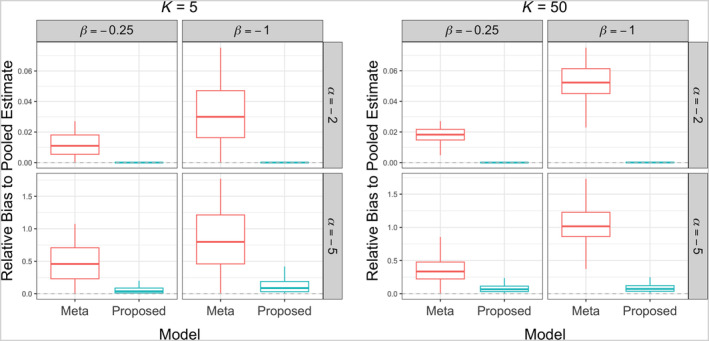
FIGURE 3.

Comparison between the meta‐analysis method (left box, red) and the proposed ODAP‐B method (right box, cyan) in terms of relative bias of to the gold standard pooled analysis when the total number of sites is 5 (left panel) and 50 (right panel).
