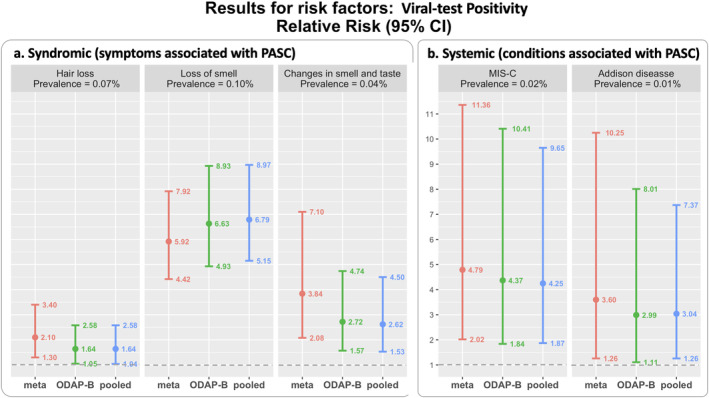
FIGURE 4.

Comparison between the estimates of the risk factor, viral test positivity, with pooled method (blue), proposed ODAP‐B (green), and meta‐analysis method (red) using the real‐world data on postacute sequelae of SARS‐CoV‐2 infection (PASC) in 184 501 children across eight national clinical sites. The dashed horizontal line (gray) represents a relative risk value of one, indicating that there is no difference in the risk of experiencing PASC conditions between the two groups (positive vs. negative).
