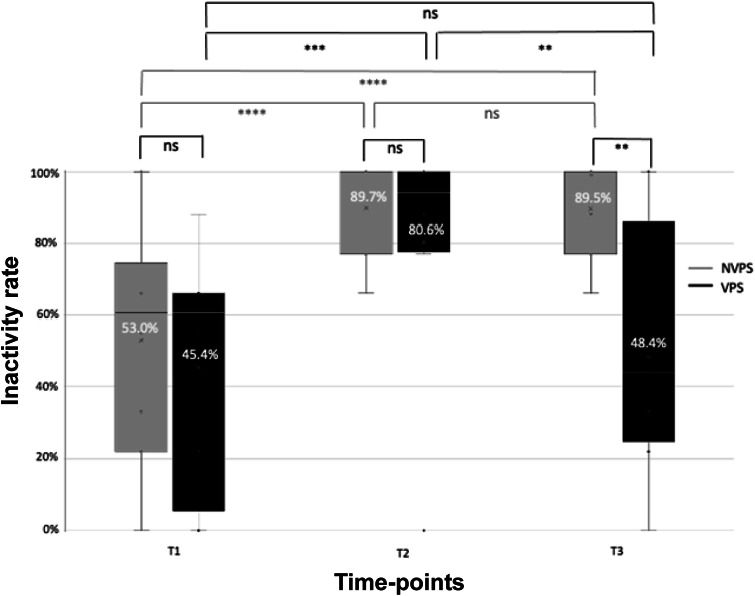
Figure 3.
Boxplots showing the comparisons of inactivity rate between groups (NVPS: light grey, n = 10; VPS: dark grey, n = 8) at three different time-points: T1 (arrival at the clinic); T2 (post-sedation recovery); and T3 (60 min after T2 with or without dog-owner interaction). Inactive rate is expressed as a percentage of times the dogs were observed lying in a ventral or sideways posture (9 samples at 2-min intervals per time-point). The numbers over the X in each box represent the mean value of inactivity rate for each group. NVPS: non-visited post-surgery; VPS: visited post-surgery; NS: non-significant; * P < 0.05; ** P < 0.01; *** P < 0.001.

