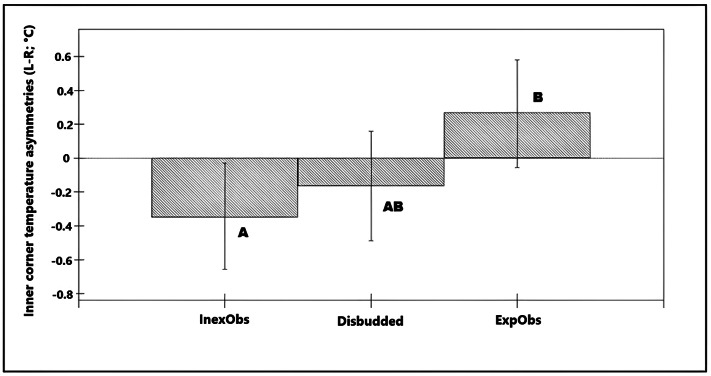
Figure 6.
Bar chart showing the predicted values for the different calf groups, based on the final model for temperature asymmetries in the inner corner of the eye (L-R) during the disbudding session (D2×T1) (n= 36 calves × 1 recording). * Bars showing different superscripts differ significantly from each other (P < 0.05).

