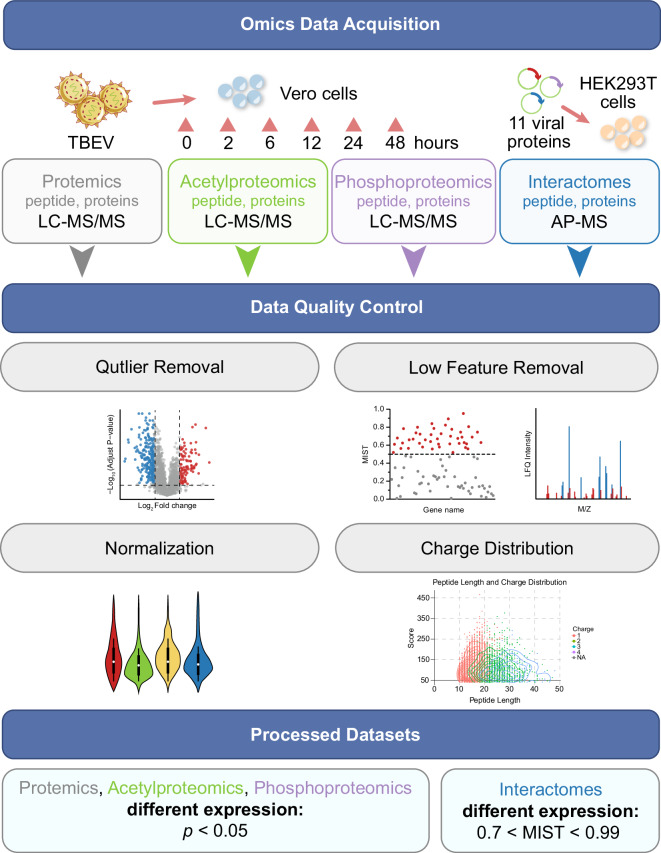
Fig. 2.
This diagram presents a workflow for processing multi-proteomics data, including proteomics, acetylproteomics, phosphoproteomics, and interactome data. The process begins with data acquisition using LC‒MS/MS and AP-MS techniques, followed by rigorous quality control steps such as outlier removal, low feature removal, and normalization. The quality control steps are illustrated with various plots depicting the statistical methods used to ensure data integrity. Following data processing, statistically significant datasets were identified with specific thresholds (p < 0.05 for proteomics and 0.5 < MIST < 0.99 for interactome) for further analysis.

