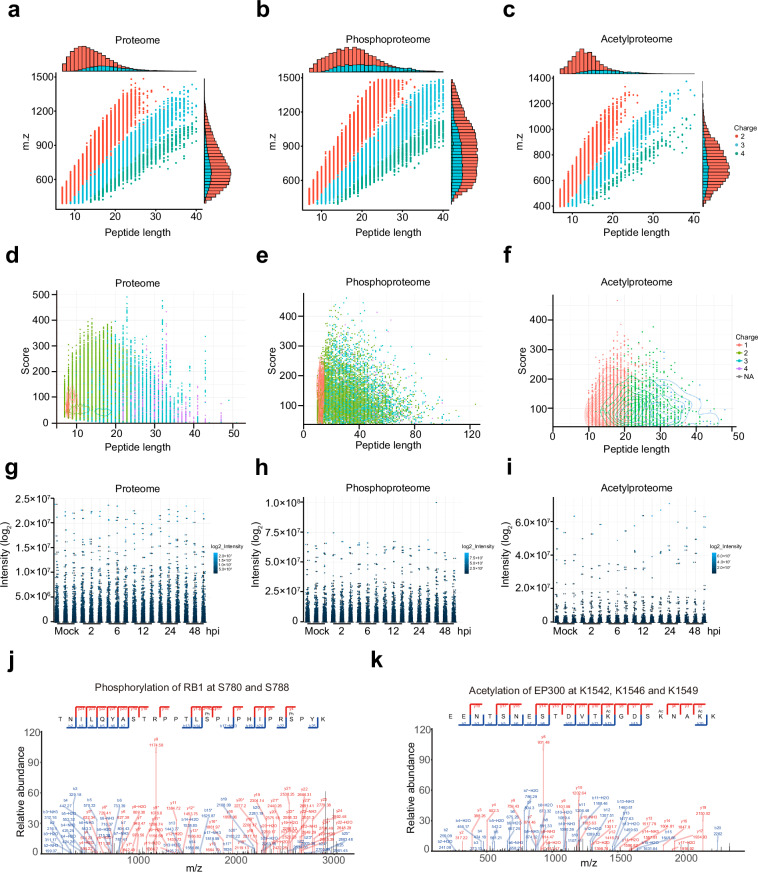
Fig. 4.
Detection of peptides in individual runs. (a–c) The relationship between peptide length and its corresponding mass-to-charge ratio (m/z). Most peptides of the proteome, acetylproteome, and phosphoproteome identified are distributed between 7 and 20 amino acids in length, aligning with the typical patterns expected from enzymatic digestion and mass spectrometry fragmentation methods. (d–f) Differences in peptide length, score, and charge state among the proteome, acetylproteome, and phosphoproteome data. (g–i) The distribution of peptide intensity values for each sample in the proteome, acetylated proteome, and phosphorylated proteome is presented. (j,k) The results of protein mass spectrometry spectra for the indicated phosphorylated (j) and acetylated proteins (k).

