Fig. 5.
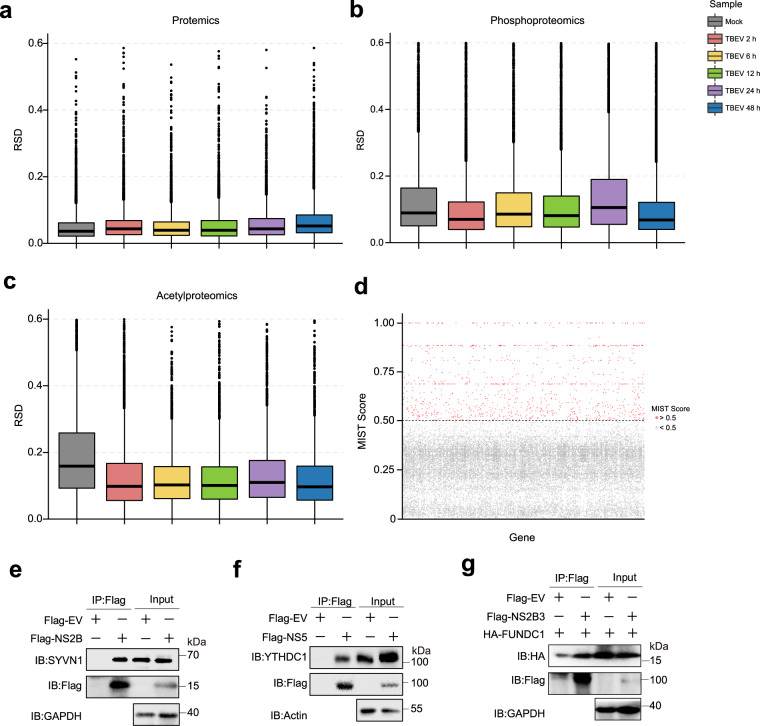
Repeatability of proteomics results. (a–c) The statistical consistency of proteomics data was evaluated using the Relative Standard Deviation (RSD) analysis. The RSD values were calculated for each sample’s three replicates. (d) The results of interactome analysis based on the MIST score, with each point representing a gene. Red dots indicate high-confidence protein interactions (MIST score greater than 0.5), while gray dots indicate lower-confidence interactions (MIST score less than 0.5). (e–g) Validation of virus-host interactions using co-immunoprecipitation. Flag-tagged empty vector (EV) or viral proteins were overexpressed in HEK293T cells, and endogenous SYVN1 co-precipitated with NS2B (e), YHTDC1 co-precipitated with NS5 (f), along with HA tagged FUNDC1 co-precipitated with NS2B3 (g), were detected using flag beads and immunoblot assay.

