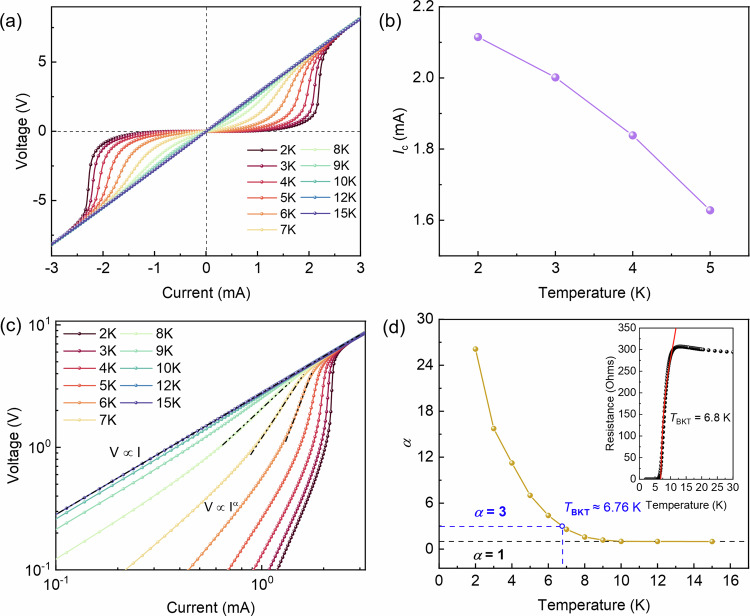
Fig. 5. Critical current and the BKT transition temperature of R-N8/S2.
a I-V curves at different temperatures. b Dependence of critical current with temperature. c Plots of the I-V curves at different temperatures on a log-scale. The relationship between current and voltage can be represented by the slope of the fitted dotted line. d Temperature dependence of α in V∝Iα. TBKT of R-N8/S2 are indicated by the blue hollow dot. The inset shows the resistance transition at zero magnetic field, and the red solid line represents the BKT transition using the Halperin-Nelson equation.

