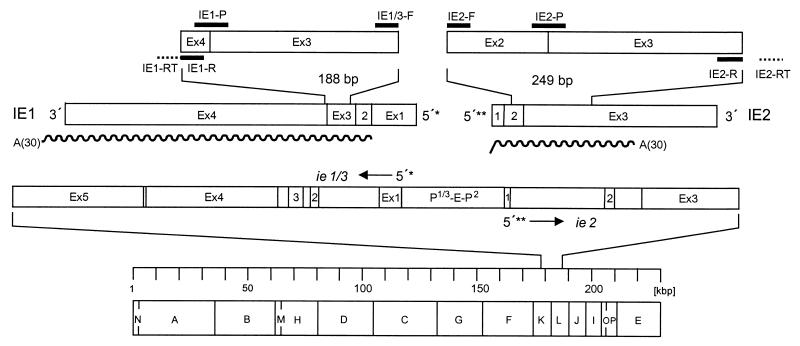
FIG. 1.
Map of the transcriptional analysis. The bottom part shows the HindIII physical map of the mCMV Smith strain genome with the IE region expanded to reveal the exon (Ex)-intron structure of transcription unit ie1/3 and gene ie2. Resolved to greater detail and drawn to scale, IE1 and IE2 transcripts, the amplified fragments therein, and the positions of all RT-PCR primers and probes (black bars) are shown at the top. The wavy lines illustrate the positions and lengths of in vitro-synthesized polyadenylated [A(30)] RNAs. The 5′-transcriptional start sites of ie1/3 and ie2 are marked by single and double asterisks, respectively. Arrows indicate the orientation of transcription. The suffix -RT denotes a specific primer for RT. The suffix -R denotes a reverse PCR primer, -F denotes a forward PCR primer, and -P denotes a hybridization probe. P-E-P, promoter-enhancer-promoter.

