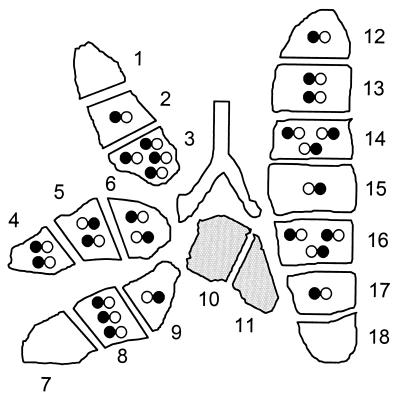
FIG. 5.
Distribution and expression pattern of transcriptional foci in individual mouse LM2. Experimental data on the expression of genes ie1 and ie2 in lung tissue pieces of LM2 (see Fig. 4) were used to calculate F(n), that is, the fraction of pieces containing n (n = 0 , 1, 2, 3, and so forth) transcriptional foci, by employing the Poisson distribution function. By multiplication with the number of pieces tested (in this case 16), the fractions are converted into the number of pieces containing n transcriptional foci. The results of the statistical calculations summarized in Table 1 are illustrated by a topographical map of the lung. The map was constructed by the “puzzle method” so as to be consistent with all information given in Table 1, that is, with the total number of transcriptional foci, the total numbers of ie1 and ie2 foci separately, and the numbers of pieces with n (n = 0, 1, 2, 3, and so forth) foci of either type. Note that, unlike in Fig. 4, the symbols here represent individual transcriptional foci (most likely individual cells) instead of the overall expression in a whole tissue piece. Since, by definition, a transcriptional focus is characterized by transcription from either ie1 or ie2 or both, the absence of transcription is not indicated by a symbol. In fact, all pieces contain ca. 16,000 latent mCMV genomes on average (Fig. 3), and thus many “silent” double-negative “foci” are present in every tissue piece. Transcription from genes ie1 and ie2 is indicated by a closed circle on the left and on the right part of the infinity symbol, respectively. Open circles symbolize the absence of the respective transcripts. Shaded pieces #10 and #11 are exempt from the transcriptional analysis because they were used for determining the viral DNA load.

