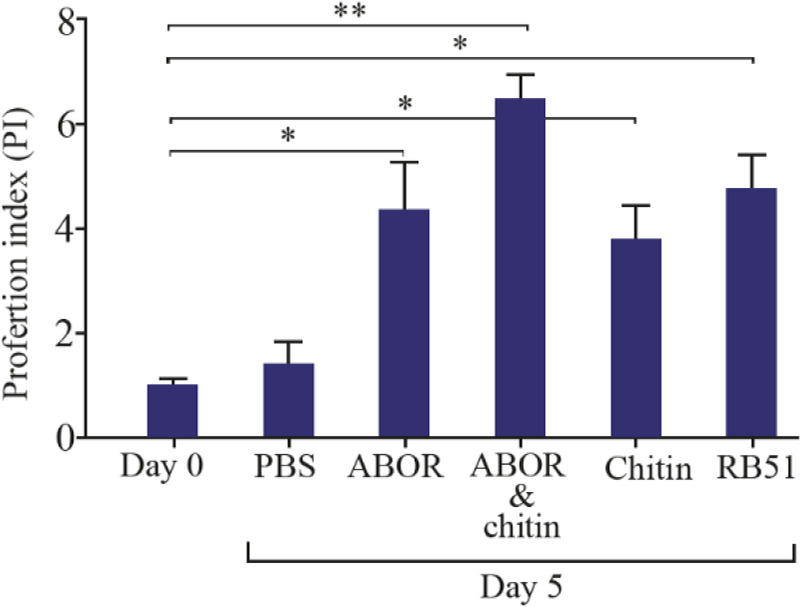
Figure 5.

Comparison of Proliferation Index (PI) in guinea pigs' spleen cells treated with RB51, ABOR+Chitin, ABOR protein, Chitin, and PBS groups on days 0 (before treatment), and the calculated PI [OD of test sample−OD of negative control/OD of negative control].
