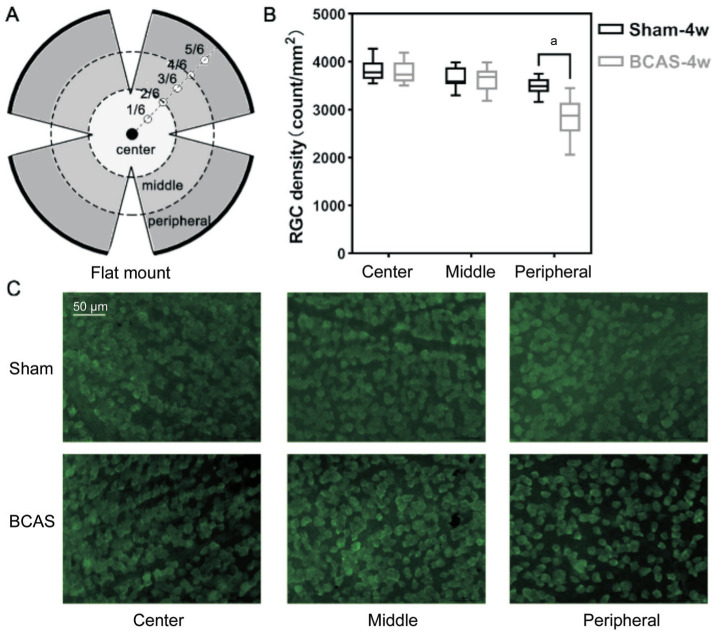
Figure 6. RGC density.
A: The flat mount of the retina and three regional subdivisions (center, middle, and peripheral); B: RGC density in the three regions on postoperative day 28; n=5 in each group, aP<0.05 between the sham group and BCAS group (Student's t-test); C: Anti-RBPMS (green) staining of three retinal regions in the sham and BCAS mice on postoperative day 28; scale bar, 50 µm. RGC: Retinal ganglion cell; BCAS: Bilateral carotid artery stenosis.

