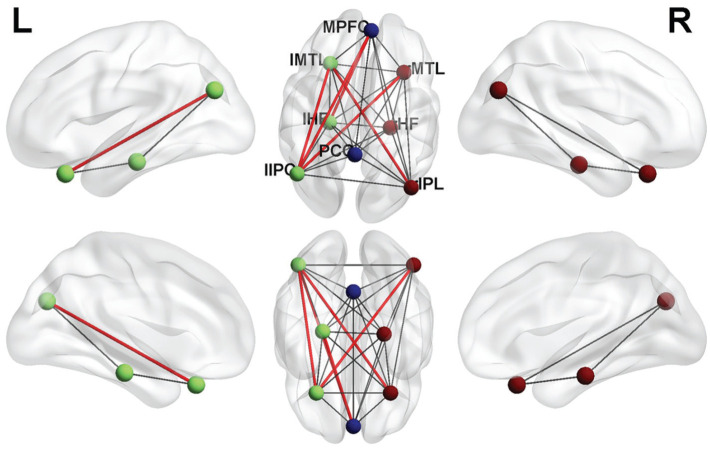
Figure 3. The different functional connectivity of the DMN between the ET and HC group.
There were significant differences between ET and HC subjects. The different colored dots represent different nodes; the red lines denote stronger correlations in ET group at the threshold. P<0.05. ET: Eye trauma; HC: Healthy control; DMN: Default mode network; PCC: Posterior cingulate cortex; MPFC: Medial prefrontal cortex; HF: Hippocampus formations; IPL: Inferior parietal lobule; MTL: Medial temporal lobe.

