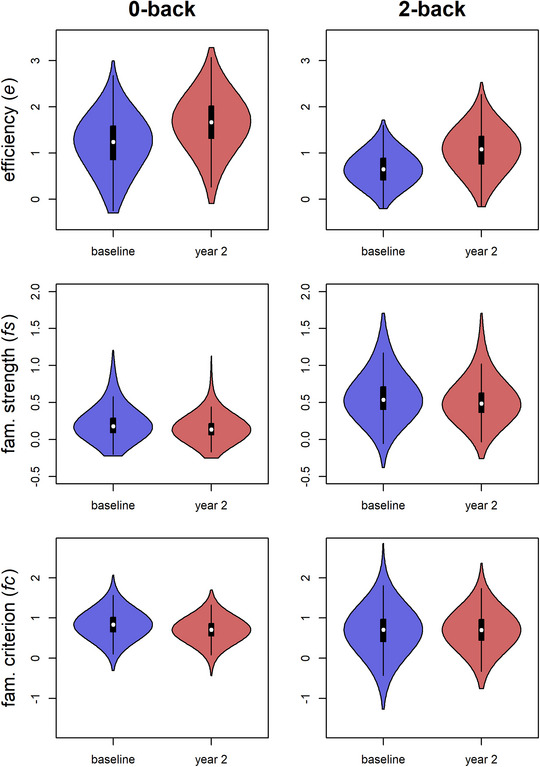
Fig. 2.

Distributions of ABCD participants’ parameter estimates, including efficiency of evidence accumulation for the goal‐relevant choice (e), the strength of goal‐irrelevant evidence related to familiarity (fs), the shifts in the criterion for familiarity evidence (fc), across n‐back load conditions and across the baseline (blue) and year 2 (red) waves. Distributions are represented as violin plots, which are standard box plots that are embedded within kernel density plots of the same data.
