
Fig. 5.
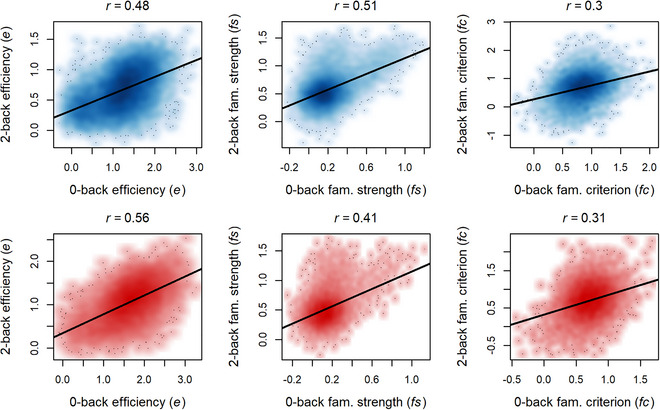
Plot of parameter correlations across levels of working memory load for the baseline (blue) and year 2 (red) samples. Black lines indicate linear regression lines for the associations of parameters across load levels.
Official websites use .gov
A
.gov website belongs to an official
government organization in the United States.
Secure .gov websites use HTTPS
A lock (
) or https:// means you've safely
connected to the .gov website. Share sensitive
information only on official, secure websites.
Plot of parameter correlations across levels of working memory load for the baseline (blue) and year 2 (red) samples. Black lines indicate linear regression lines for the associations of parameters across load levels.