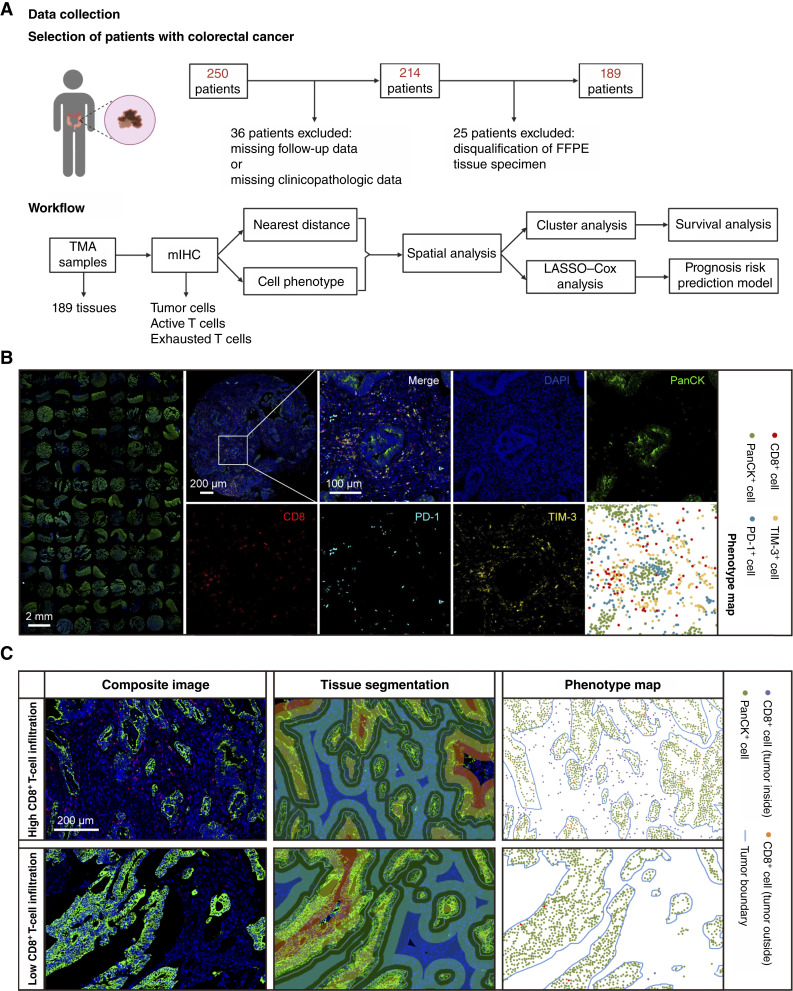
Figure 1.
Schematic approach and different infiltration patterns of T cells among colorectal cancer tumors. A, Selection of patients with colorectal cancer and workflow of the present study. B, Representative images of multiplex immunofluorescence staining (PanCK, green; CD8, red; PD-1, cyan; and TIM-3, yellow) and phenotype map. C, Representative images of tissue segmentation and phenotype maps of high and low CD8+ T-cell infiltration. Blue lines represent tumor core area boundaries. DAPI, x; FFPE, formalin-fixed paraffin-embedded.

