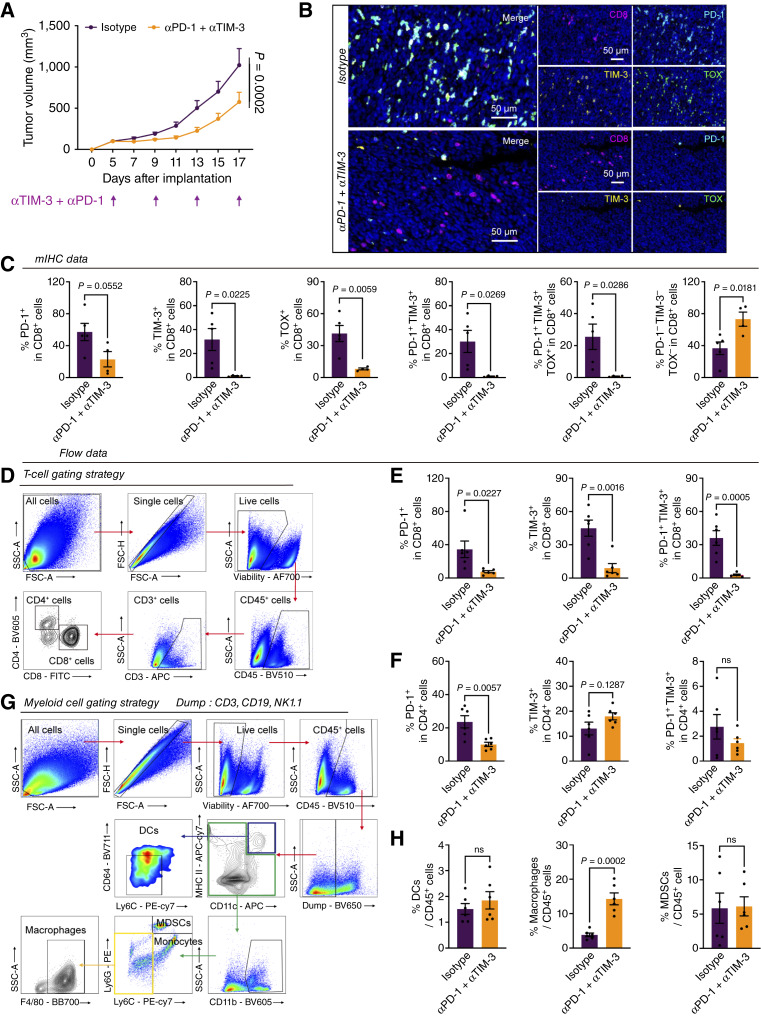
Figure 4.
TIM-3 and PD-1 dual blockade reverses T-cell exhaustion and enhances the antitumor immune response. A, Tumor volume. A measure of 2.5 × 10⁵ CT26 cells were injected subcutaneously into BALB/C mice, followed by treatment with isotype or αPD-1 (RMP1-14) and αTIM-3 (RMT3-23) antibodies (10 mg/kg) every 4 days (isotype: n = 6 mice per arm; αPD-1 + αTIM-3: n = 7 mice per arm). Data are presented as the mean ± SEM and determined by two-way ANOVA. B, Representative images of multiplex immunofluorescence staining (CD8, red; Ki67, white; PD-1, cyan; TIM-3, yellow; and TOX, green) in isotype or αPD-1 + αTIM-3 treatment tumor. C, mIHC quantification of PD-1+CD8+ T cells, TIM-3+CD8+ T cells, TOX+CD8+ T cells, PD-1+TIM-3+CD8+ T cells, PD-1+TIM-3+TOX+CD8+ T cells, and PD-1−TIM-3−TOX−CD8+ T cells as a percentage of CD8+ cells. Data are presented as the mean ± SEM and determined by a two-tailed unpaired t test. D, T-cell panel gating strategy. E, FACS quantification of PD-1+CD8+ T cells, TIM-3+CD8+ T cells, and PD-1+TIM-3+CD8+ T cells as a percentage of CD8+ T cells. Data are presented as the mean ± SEM and determined by a two-tailed unpaired t test. F, FACS quantification of PD-1+CD4+ T cells, TIM-3+CD4+ T cells, and PD-1+TIM-3+CD4+ T cells as a percentage of CD4+ cells. Data are presented as the mean ± SEM and determined by a two-tailed unpaired t test. G, Myeloid cell panel gating strategy. H, FACS quantification of dendritic cells, macrophages, and myeloid-derived suppressor cells as a percentage of CD45+ cells in the αPD-1 + αTIM-3 experiment. Data are presented as the mean ± SEM and determined by a two-tailed unpaired t test. DC, dendritic cell; MDSC, myeloid-derived suppressor cell.

