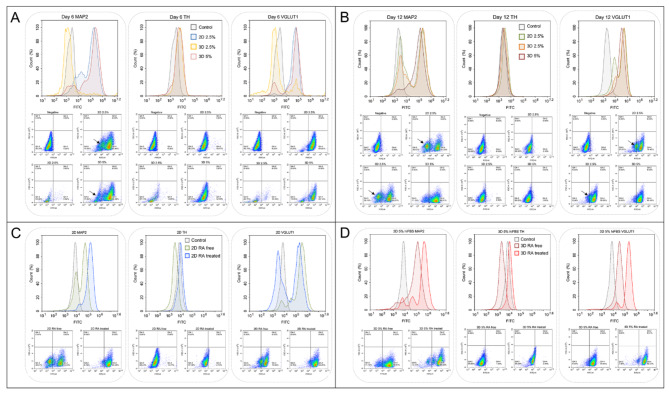
Fig. 2.
Differentiation and maturation of SH-SY5Y cells in 2D and 3D cultures assessed by flow cytometry analysis. (A) FACS analysis on day 6 of differentiation. The black arrow indicated the population of undifferentiated cells (B) FACS analysis of cells cultured in maturation media without RA. The black arrow indicates the population of undifferentiated (C) Comparison of neuronal marker expression in 2D cell cultures with and without RA treatment. (D) Comparison of neuronal marker expression in 3D spheroids cultured in 5% hiFBS with and without RA treatment.

