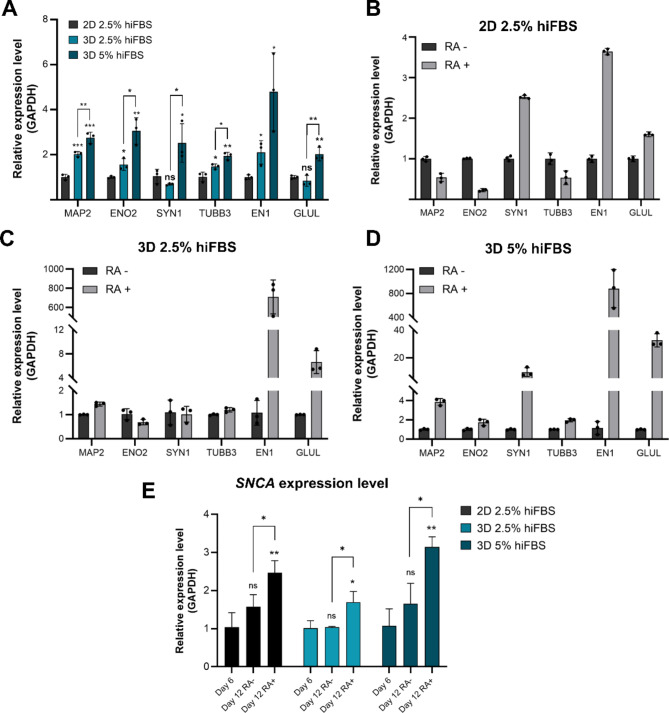
Fig. 4.
Relative expression of different mature neuronal markers in 2D, 3D 2.5% hiFBS and, 3D 5% hiFBS after 12-day maturation process with and without RA. (A) Relative expression of 3 culture platforms and conditions with presence of RA in maturation media. Significant differences between different cultured conditions were evaluated. (ns = not significant, *p < 0.05, **p < 0.01, ***p < 0.001, unpaired Student’s t-test, n = 3) (B) The effect of RA on level of neuronal markers in 2D culture. (C) The effect of RA on expression level of neuronal markers in 3D 2.5% hiFBS. (D) The effect of RA on expression level of neuronal markers in 3D 5% hiFBS. (E) Serum concentration and RA effect on SNCA expression level. The vertical axis shows the relative gene expression levels as the means ± SE (n = 03). Bars represent the means of three replicates ± SD.

