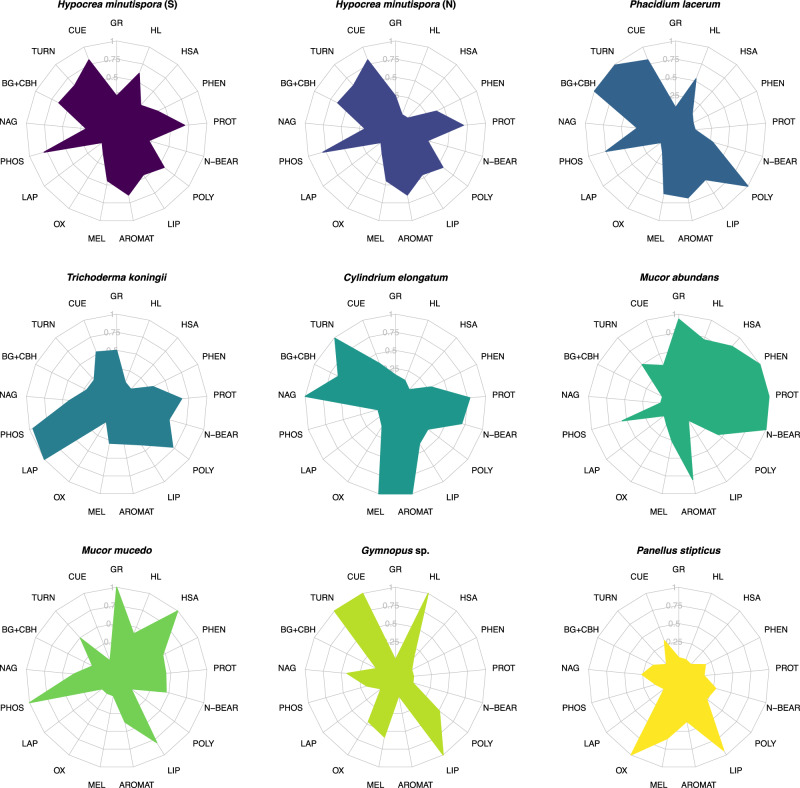
Fig. 1. Radar plots illustrating trait profiles of fungal species.
Trait values are scaled between 0 to 1 across species for each individual trait measurement, where 0 represents the lowest relative value of trait expression, and 1 represents the highest relative value (n = 3). Species are ordered from high trait multifunctionality scores (top row) to low trait multifunctionality (bottom row), and the color associated with each fungal species is carried throughout subsequent plots. Text abbreviations around the radar plots represent individual traits. Trait abbreviations are as follows: GR = growth rate (average of two metrics; μg biomass-C produced biomass-C−1 hr−1); CUE = carbon use efficiency (average of three metrics; units of C); MEL = melanin (mg g−1 biomass); TURN = biomass turnover time (reflected such that a high value corresponds with high turnover rate); BG + CBH = combined activity of beta-glucosidase and cellobiohydrolase (μmol substrate h−1 g−1 dry soil; same units for all subsequent enzymes); NAG = N-acetyl-glucosaminadase activity; PHOS = acid phosphatase activity; LAP = leucine aminopeptidase activity; OX = combined activity of phenol oxidase (ABTS) and peroxidase (TMB); AROMAT = relative abundance (%) of aromatic compounds in fungal biomass; LIP = biomass lipids (%); POLY = biomass polysaccharides (%); N-BEAR = biomass N-bearing compounds (%); PROT = biomass proteins (%); PHEN = biomass phenols (%); HSA = hyphal surface area (m2 g−1 dry soil); HL = hyphal length (m g−1 dry soil). Source data are provided as a supplementary Source Data file.

